English
 Chinese

The Core Determinants of Performance Measurement Systems for Innovation in Chinese Cosmetics Industry, Case Study: L’Oréal China
Submitted in the Degree of Master of Science in Marketing
2020
Management School of Queen’s University Belfast
Abstract
2.1 Organisational Performance
2.1.2 Classification and Measurement of Organisational Performance Indicators
2.1.3 The Definition of Organisational Performance in this Study
2.2 Marketing Innovation and Performance Metrics
2.2.2 The Innovation of Marketing Methods
2.3 Market-Driven Orientation and Performance
2.3.1 Customer-Driven Orientation and Performance
2.3.2 Competitor-Driven Orientation and Performance
2.4 Driving-Market Orientation and Performance
2.4.1 Driving-Customer Orientation and Performance
2.4.2 Driving-Competitor Orientation and Performance
2.5 Hypothesis and Conceptual Framework
4.1.7 Summary of Quantitative Analysis
4.2.1 Product Innovation and Marketing Method Innovation
4.2.2 Driving-marketing Versus Market Driving Orientation
6.2 Limitations and Recommendations for Further Research
Appendix – the Results of Correlation Analysis
1.0: Introduction
1.1 Research Context
With the incoming Industry 4.0, increasingly more companies pay heavy attention to innovation management especially performance management for innovation. Innovation performance is covered by organisational performance. Organisational performance can be measured by return on assets, sales growth, new product success rate (Naver and Slater, 1990), market share and general performance (Jaworski and Kohli, 1993). Previous literature suggests that innovation performance measures cover product innovation (Wind and Mahajan, 1997), marketing method innovation (Andrew and Smith, 1996), digital marketing (Mosquera et al. 2018), market-driven innovation (Morgan and Hunt, 1995), and driving-market innovation (Hamel and Prahalad, 1991).
In the age of Industry 4.0, new generation technologies such as Artificial Intelligence (AI) and big data analytics can are promised to change business environment and competition landscape (Alonso, 2020). The significant change pushes all companies in all industry to heavily invest in innovation. However, the risks of innovation are diverse and high that can threat an organisation’s performance including cash flow and competitive advantages. Nechaeve et al. (2014) illustrate that failed innovation project tends to negatively affect a company’s cash flow and even lead to bankruptcy because the costs of innovation can be high. Meanwhile, failed innovation project negatively affects a company’s competitive advantage in dynamic market. Walker (2004) highlights that innovation acts an important role in organisational performance. Therefore, it is significant to identify an effective system to measure innovation performance.
Product innovation is an important and strong factor affecting competitive advantages in cosmetics industry because products in the industry have a short lifecycle and customers demand the latest products (Kumar et al., 2016). Also, Szutowski and Szułczyńska (2017) also highlight the significance of innovation in cosmetic industry. Chinese cosmetics industry is rising while competitive. The industry’s revenue held 12.7% of total global cosmetics market in 2018, followed by the UK (12.1%) and the US (10.9%) and the industry was estimated to grow with an AAGR of 8.16% between 2017 and 2022 (Prenewswire, 2019). It has been predicted to climb to CNY 439 billion by 2024 (Statista, 2020). In other words, Chinese cosmetics industry has been larger than the UK and the US and growing fast. Therefore, ensuring high level of innovation performance is important for players in the industry to gain competitive advantages.
1.2 L’Oréal
Loreal is a multinational corporation engaging in customer goods industry and focusing on personal care products, hair colour, skin care, sun protection, perfume etc., headquartered in Paris (Loreal-Finance, 2020). The company is the largest cosmetic by revenue and operates in 130 countries (Loreal-Finance, 2020). Loreal’s sales revenue reached 29,873 billion euros and realised 5,547 billion euros operating profit increased by 12.7% (Loreal-Finance, 2020). The company has been actively using its innovation to strengthen its e-commerce. Its sales in e-commerce increased by 52.4% and reached 4.6 billion euros accounting for 15.6% of total revenue in 2019 (Loreal-Finance, 2020).
Loreal has proficiency in innovation empowered by its strong R&D capabilities (Marr, 2019). These capabilities help the company to effectively response dynamic market demands. The company takes its advanced and success innovations to maintain its competitive advantages in the market. In China, Loreal has been actively collaborating with online retailing giants especially Alibaba Group to achieve localised innovation in process (Loreal Finance, 2019). Along with the Group, the company has developed live steaming personal selling approach, which aroused a phenomenon in the country. Given that the company has strong innovation performance in China, it is reasonable to use it as a case to study effective system of measuring innovation performance.
2.0: Literature Review
In this chapter, the dissertation provides a general overview of the research that will involve the existing theories about china as the origin country of this organisation and help explain its importance to the world business. Other approaches that will be discussed in this chapter include the organisation’s performance, other parts include how to develop the marketing performance using this organisation in china and the ways to measure the system in the market innovation to the environment. In the organisation’s performance, the section will talk much of the conceptual framework, classification and measurement of organisational performance indicators, the definition of organisational performance in the study. The next section involves marketing performance which contains the chain of marketing performance metrics, the assessing framework involved, theoretical rationale. The next section of this chapter will explain the marketing innovation and performance metrics that contain product innovation, marketing program innovation, digital marketing. The next after the above section is market-driven orientation and performance which explains more about customer-driven orientation and performance, competitor-driven orientation and performance. The next section in this section will explain driven-market orientation and performance which also shed light on driven-customer orientation and performance, driving-competitor orientation and performance.
2.1 Organisational Performance
In organisational science, the standard model for theory testing and measurement development states two things, firstly, that before operationalization can begin, a construct’s conceptual domain must be delineated and understood. Secondly, the measures used should be representative of the indicators of the domain that they are measuring. This chapter will examine the performance outcomes of various firms’ marketing efforts using academic understandings of operational and Organisational performance within strategic management. (Hamann et al. 2013).
2.1.1 Conceptual framework
Organisational performance is the core of corporate strategic management because performance is an effective test of the implementation of corporate strategies (Chung, Wang and Huang, 2012). Nonetheless, although the importance of performance is widely recognized, the measurement of Organisational performance has always been one of the most challenging problems that strategic-management scholars must face (Venkatraman and Ramanujam, 1986). There is no general theoretical evolution to underpin the Organisation-performance theory. This is because Organisational performance has different meanings for different types of Organisations, and the interests and values of different assessors (Chaiyasit, 2019). Nevertheless, for the definition of Organisational performance, general Organisational scholars have agreed that performance is not a concept, but a structure.
Construction cannot be transformed from concrete events in the real world but must go through an abstract deduction process. Campbell (1977) pointed out that Organisational performance must be regarded as a structure. Specifically, it must be constructed via a theoretical paradigm of Organisational performance, and is devoid of operational definition, at least in a direct sense. The function of the conceptual model is to find the variables that are worth measuring, the relationship between the variables, or precisely the current relationship between the variables. Therefore, scholars use diverse scientific approaches and doctrinal models to define measurement methods for Organisational performance.
Based on a review of the existing literature, Ford and Schellenberg (1982) presented three summarized criteria whereby performance may be defined. These are as follows.
(1) Goal: when a company establishes a clear final goal, performance may be defined according to its achievement or non-achievement (Etzioni, 1964).
(2) System resource: Yuchtman and Seashore (1967) emphasized the relationship between an enterprise and the business environment and judged the performance of the enterprise by its ability to possess scarce and valuable resources.
(3) Composition: performance may also be defined in terms of the interaction between an Organisation and its constituent members (Steers, 1977).
Later, Ruekert, Walker and Roering (1985) defined performance in terms of three dimensions:
(1) Efficiency: the ratio of the resources invested by the enterprise to the output, expressed in terms of return on investment (ROI).
(2) Effectiveness: the products and services provided by the company are usually related to its sales-growth rate or market share, compared with competitors.
(3) Adaptability: the ability of an enterprise to respond to environmental threats or opportunities, expressed in terms of the number or sales rate of products successfully launched during a certain period.
An Organisation’s performance, then, can be interpreted from a variety of perspectives. Nonetheless, in general, performance is a measure of the degree to which an Organisation’s goals are achieved, and the differences in the views of different scholars are manifested in different perspectives or methods of decomposition of Organisational goals. Self-perspective is also significant, however, as desired results are generally set by management, which also monitors the output on various levels, effective or otherwise, which the company deploys to attain its objectives (Cao and Pederzoli, 2013, pp. 289-310). It can be seen that performance indicators are one of the indispensable indicators for Organisational operation and marketing activities.
2.1.2 Classification and Measurement of Organisational Performance Indicators
To fully understand and use Organisational-performance indicators, such performance indicators need to be classified. Generally, Organisational performance can be approached from three different perspectives: (1) single and multiple indicators, (2) financial indicators and non-financial indicators, and (3) subjective indicators and objective indicators. The following section will consider each in turn.
Single indicators and multiple indicators
Both single and multiple indicators may be utilized to evaluate Organisational performance. One may take a unit as an indicator of corporate achievements, such as productivity, employee satisfaction, profit, or stable growth of the Organisation. Since this approach of performance assessment, based on a single variable, is easier to apply, it tends to find favour with researchers. Capon, Farley and Hoening (1990) reviewed 320 empirical studies from 1921 to 1987 and found that performance-measurement choices used a single indicator consistently. Especially for business enterprises, the goal of the Organisation's existence is to maximize profits. Hence, a single economic variable such as productivity, efficiency, etc., is often the most critical Organisational-performance indicator for business managers. Moreover, one particular indicator – i.e. sales rate of return – has a formidable track record as an evaluation tool in the context of corporate and technological strategy.
Conversely, those who advocate the deployment of multiple indicators point out that Organisations generally have more than one objective. Therefore, evaluating the performance of the entire Organisation with a single variable cannot express its broad and systematic aims. Different Organisations should be measured by different indicators. Thus, Organisational performance should have multiple indicators in order to be ‘reasonable’ (Robbins, 1990). Hence, the deployment of multiple indicators is gaining increasing traction within academia. For instance, Kaplan and Norton (1990) measured an Organisation’s operating performance based on four aspects, namely: (1) finance (including return on investment and economic value added); (2) customers (satisfaction, retention, and market share); (3) employee satisfaction, and (4) employee development.
Financial indicators and non-financial indicators
In terms of the performance of most Organisations, indicators may be subdivided into financial and non-financial. Financial indicators are the most basic method of judging Organisational performance. Covariates include profitability, turnover-growth rate, return on investment (ROI), return on assets (ROA), et al. (Dess and Robinson, 1984; Venkatraman and Ramanujam, 1986).
Since financial statements offer a convenient source of information, financial indicators are a popular and convenient research tool. Moreover, for most companies, especially those in the same country or region, which by law apply the same financial-accounting systems, financial information in terms of performance is more readily comparable (Jan and Victor, 2019, pp. 68-79). Even for enterprises in different countries or regions, although the financial and accounting systems are different, globalization facilitates comparison. Accounting differences are receding within this trend, and adjustments to facilitate comparison are generally not difficult to implement (Kapferer, 2010, pp. 40-45).
With the further development of market-oriented research, however, more and more studies have found that financial indicators cannot fully reflect the operating conditions of enterprises (Lee, 2005). If the company aims at sustainable operation, then it will sacrifice short-term benefits to lay the foundation for its long-term development. For example, investment in R&D and branding may be sacrificed. Hence, several scholars have argued for the importance of non-financial indicators in calibrating performance. These may include relative market share, relative brand recognition, customer satisfaction, customer loyalty, etc. All may be highly significant is assessing corporate performance.
For example, Venkatraman and Ramanujam (1986) proposed to measure financial performance, corporate performance and Organisational performance in three dimensions. Indeed, for Homburg and Pflesser (2000), in the context of the relationship between performance and market-oriented corporate culture, performance must be assessed according to both market performance and financial performance. Market performance is defined as the effect of a company's marketing activities, which is in turn measured by the company's customer satisfaction, customer value provided, and market share achieved. The authors acknowledged that enterprise growth in the longer term would be impacted by loyalty, relationship-based customer satisfaction and other factors that are more complex than 'pure' profit. The research results of Homburg (2000) show that market orientation has an impact on corporate performance. Indeed, such orientation affects performance not only in financial but also in market terms. Research by Reicheld and Sasser (1990) also shows that there is a strong relationship between corporate market performance and corporate profits. Key factors here include customer loyalty, customer satisfaction, the value of products and services that customers obtain, employee capabilities, employee satisfaction, and loyalty.
Overall, the measurement of Organisational performance requires the assessment of comprehensive financial indicators and non-financial indicators, such as market performance. Although financial indicators are the ultimate economic manifestation of Organisational activities, the moderating effect of market performance on Organisational activities and financial performance cannot be ignored. Some corporate activities, such as investment in public relations, commitment to outstanding customer service, etc., may not have a distinct, immediate relationship to financial performance (Homburg, 2000). Nonetheless, they can all produce excellent market performance, thereby promoting sales and improving financial performance in the longer term. Therefore, when evaluating Organisational performance, both financial indicators and non-financial indicators should be considered comprehensively. An objective and reasonable appraisal of an Organisation’s operating results, and its broader operating status, can only be attained when both sets of variables are carefully appraised.
Subjective Indicators and Objective Indicators
Enterprise performance indicators can be divided into subjective indicators and objective indicators. Subjective indicators refer to the use of scales to measure the business performance of a company in terms of "very good", "very poor", or "very low" or "very high" compared with competitors or its own expected goals (Zhang, 2005). The objective indicators refer to exact data, such as sales growth percentage or profitability. In the research on market orientation and Organisational performance, subjective indicators, objective indicators, or a combination of subjective indicators and objective indicators are utilized.
Dess and Robinson (1984) suggested that when researching Organisational performance in the general management field, researchers often face the problem of inconsistent performance comparison standards or the inability to obtain financial data. They suggest that subjective performance measurement standards can be utilized as a measurement tool. Delaney and Huselid (1996) believe that when judging whether an enterprise or institution has achieved its goals, it is necessary to add some subjective judgments to evaluate the performance of the Organisation, and cognitive indicators are usually highly correlated with objective indicators. Numerous kinds of literature use a combination of financial indicators and non-financial indicators, subjective indicators and objective indicators. However, there is no specific principle on how to match various indicators. The researcher determines the variables based on the causality of the model. Some scholars believe that indicators should have the ability to distinguish, and their interdependence should be reduced. However, in actual use, the indicators commonly used in relevant research studies should still be the first choice. This approach increases the comparability of research models and conclusions.
2.1.3 The Definition of Organisational Performance in this Study
In the literature on marketing and Organisational performance, some use return on assets, sales growth, and new product success as performance measures (Naver and Slater, 1990), and some use market share or overall performance (Jaworski and Kohli, 1993). As a performance measure. Furthermore, market performance is used by some researchers as an essential measure of performance, because market performance represents the effectiveness of a company in marketing activities, and can be measured by improving customer satisfaction, customer value, customer retention, market share and other items. The market performance view can better reflect the characteristics of market-oriented enterprises (Homburg and Plfesser, 2000). However, some critics believe that market performance and financial performance are closely related, especially the relationship between long-term market performance and the company's long-term financial performance, so the value of distinction is not great. This article intends to use subjective self-evaluation to measure the business performance of enterprises. As Dess and Robinson (1984) pointed out, employees may be reluctant to disclose specific figures on business performance due to business sensitivity or confidentiality considerations. Govindarajan (1984) pointed out that anonymous participation in questionnaires can also cause difficulties in using objective data.
Additionally, in cross-industry profit performance research, subjective indicators are more suitable than objective indicators. That is because the profit levels of different industries are different. If objective indicators are used, they may confuse the relationship between the dependent variables and corporate performance (Ostapenko, 2015). In this case, the use of subjective measurement indicators makes it easier for managers to compare the performance of the company with the profit level of the industry when answering the questionnaire. Performance indicators such as profit may not accurately reflect the financial status of an enterprise. Not to mention that the profit may vary due to different accounting treatment methods (Richiardi and Arbo, 2019). If the company is in a different investment period, and the investment in R&D or marketing activities is substantial, its profitability may take a long time to be reflected in the statement. Brownell and Dunk (1991) also believe that no evidence directly proves that the internal management accounting statements, cash flow statements, and return on investment of the enterprise will be more objective than self-evaluated performance.
2.2 Marketing Innovation and Performance Metrics
Since the market performance (chain of marketing performance metric, assessing framework and the theoretical ) has been analysed in the above section, in this part the research will give more explanation on ways the product can be innovated, ways in which marketing programmed can be innovated and the involvement of digital marketing and other parts involved.
2.2.1 Product Innovation
Research on the development of new products shows that the characteristics of innovation affect the adoption of new products by customers (Rogers, 1983). Among these characteristics, the advantages of new products are critical for explaining the process of new product adoption and (Holack, 1988) and the success of new products (Gatignon and Xuereb, 1997). Generally, the advantages of new products are composed of the quality, cost, reliability, novelty, and/or unique customer value of new products (Calantone and Cooper, 1981). Among these elements, innovation and value are regarded as the two most important aspects of product differentiation (Cooper, 1983), and are considered key to a company's market performance. Research on different industries also shows that no matter in which industry, innovation is conducive to the improvement of corporate performance (Subramanian and Nilakanta, 1996). Research has also confirmed that the higher the degree of product innovation, the more profit the company can obtain, and the better the performance of the company (Wind and Mahajan, 1997), and the profit created by breakthrough innovation may be vast and lasting (Geroski et al., 1993). Besides, modern marketing theories have always attested that when the difference between a company's product and its competitors or substitutes reaches a certain level, and this difference is considered valuable by consumers, the product will perform well in the market (Cooper, 1994). Resource advantage theory (Hunt and Morgan, 1995) argues that companies that imitate strategies can often get a certain return, and innovation-oriented companies are more likely to gain a competitive position and excellent financial performance through innovation.
2.2.2 The Innovation of Marketing Methods
Researchers have paid a lot of attention to the relationship between product innovation and marketing performance. However, in theoretical research, only a few researchers have paid attention to the impact of marketing method innovation on marketing performance. This research asserts that to ensure the achievement of marketing performance, marketing method innovation is indispensable. The author explains theoretically as follows: First, in a fickle and uncertain market environment, marketing method innovation can make the differentiated advantages of new products not quickly destroyed by competitors' power (Andrew and Smith, 1996). Second, new products and new technologies have high customer-perceived risks, and the innovation of marketing programs makes new products more attractive to consumers and can better meet their needs. Third, the study of the new product diffusion model also believes that the company's unique marketing method has a significant impact on the adoption rate of new products (Bass, 1980). Ultimately, product differentiation is one of the sources of differentiated advantages of a company, but it is not the only source. Creative marketing programs may also enable companies to obtain valuable differentiated competitive positioning (Poter, 1980). This logical reasoning about the innovation marketing methods and organisational performance has also been confirmed by Menon et al. (1999). Their empirical research shows that marketing strategy innovation has a positive and direct impact on market performance.
2.2.3 Digital Marketing
In this section, some terminology will be defined, and some main concepts will be analysed which are related to L’Oréal, the technology involved in the market, and ways to improve digital marketing performance.
Main Concepts and Terminology Definition
“Digital marketing” refers to the ways various products and brands are promoted across digital marketing channels and electronic media (SAS Software 2014). The term “marketing technology” refers to the fusion of both marketing and technology and incorporates the technological tools that companies use to perform marketing activities. The term dates to 2010, a point at which it was not possible to conceive of modern marketing without technological intervention. “Marketing technology” is also referred to as the abbreviation, “MarTech”. Excluding mobile and online marketing technologies, there are various other forms of digital marketing, including retail marketing, electronic billboards, and consumer interaction using displays. “Marketing channels” refers to the various routes, channels, and platforms that companies influence consumers with. These channels represent people, intermediaries, and activities that together help transfer the ownership of a good or service from producer to consumer. As Bhasin (2018) notes, they are interdependent and interact with each other. The related term “omnichannel” describes a type of retail experience where customers can both shop across channels and interact with the brand regardless of time or place. This provides the consumer with a unique, seamless retail experience that removes the barriers between physical and virtual stores (Mosquera et al. 2018, 64). As Payne, Peltier, and Barger (2017, p.189) note, omnichannel marketing provides consumers with a holistic retail experience that ensures their purchasing journeys are smooth, regardless of individual channels used.
The term “multi-channel” denotes the use of two or more marketing channels that are synchronized (Payne, Peltier, and Barger 2017, p.186). These channels are used to deliver a company’s marketing messages directly to customers in order to boost the distribution of the company’s products. Technological advances have led to the emergence of the multi-device consumer; someone who uses several channels at the same time (Mosquera et al. 2017, p.65). The term “marketing metrics” defines the various ways to measure the efficiency, effectiveness, and success of a company’s given marketing activities. The immediacy of digital marketing, along with advanced analytical tools, makes it possible for analysts to measure, monitor, and test the success of digital campaigns in real-time, to learn what strategies are most successful. This in turn helps companies achieve higher ROIs and makes for a better consumer experience (SAS Software 2014).
Marketing Technologies
The average consumer will use five different pieces of technology in a day. This could include one or more smartphones, a work laptop or desktop computer, a personal laptop or computer, a tablet, and a Smart TV (Digital Marketing Institute, 2016). Companies that see this as an opportunity to target consumers through all available devices and channels are unlikely to succeed, as they will be perceived as annoying or intrusive by the consumer and likely ignored (Odoardi, 2019). A better goal is to use these tools to engage consumers’ attention and interest and to try and keep them engaged for a long period. This can be done in two ways. The first is to get the consumer involved in a dynamic brand relationship with good benefits and engaging interaction. The second is to ask them to help build the brand through contributing recommendations and opinions (Lee, 2005). This helps maximize the consumers’ loyalty and sense of brand attachment. Marketing managers will do well to remember that brands only exist because of consumers and so engaging these people and listening to them is of vital importance. In marketing, the human touch is essential, but it is the technology that can help elevate a brand-consumer relationship and, in turn, see companies thrive.
Effective marketing relies on digital technology since this increases an organisation’s capability to research customers, competitors, and the wider market (Foroudi et al. 2017, p.232). Although this is industry-dependent, the advent of new technologies in marketing will play a role in improving a company’s competitive advantage and overall market position. When judiciously adopted, digital technology will enhance an organisation’s ability to respond well to consumer needs, which will also improve customer-facing operations. Perhaps the biggest contribution of digital technology is that, by focusing on consumers and the business, it helps boost sales and reduce costs, leading to a more efficient company (Foroudi et al. 2017, p.239). Developments in technology offer ways for small and medium-sized enterprises (SMEs) to grow and innovate, which can help them attract and retain consumers in greater numbers (Foroudi et al. 2017, p.242).
Marketing technologies can be split into two categories. The first is “must-have” technologies, which companies need to implement to remain relevant to the market and stay in existence (Jan and Victor, 2019, pp. 68-79). Most of a company’s competitors will have these and consumers would expect them to have them. Optional technologies are those which will support business and help improve its financial results, but which are mostly used by bigger companies with greater financial resources. Standard marketing technologies include the various solutions specifically created for marketing purposes and which are used by a wide range of companies (Chaiyasit, 2019). These include but are not limited to: a website, a mobile website, e-commerce platforms or an online shop, live chat options, search engine optimization, social media marketing, Google display advertising, “pay-per-click” advertising, mobile device applications, social media marketing for mobile phones, QR codes, in-store displays, in-store video walls, and in-store WiFi.
However, the limitation of this type of literature is that it does not compare the virtual shopping experience of consumers with the real shopping experience to obtain further research. In other words, while considering online marketing indicators, they neglected to compare them with offline marketing indicators to find differences and commonalities. This would make the digital marketing performance metrics appear to be out of the traditional knowledge field, which behaves abruptly.
Digital analytics can be used to further the links between marketing activities and long-term outcomes. They offer new and immediate ways to measure the cognitive and affective effects of various kinds of marketing and how they impact market outcomes(加cite). This dissertation suggests that digital analytics can be used both to track exposure, that is, the number of people who are exposed to a form of marketing, and reactions, that is, website traffic, mentions on social media, and search patterns. This can in turn be used to make marketing much more accurate. Through evaluating changes that occur across these metrics during the lifetime of a marketing campaign, companies may be able to get a sense of how to attract consumers and a better understanding of consumer behaviour.
2.3 Market-Driven Orientation and Performance
As from above the section one of this chapter explained about the organisation performance, section two shaded light of marketing performance in the aim of giving more explanation to the aim of the dissertation, section three also provided more information about digital marketing and technology innovation. Now this section will more on the market-driven orientation and performance on the customer- driven orientation and their performance and competitor-driven orientation and performance.
2.3.1 Customer-Driven Orientation and Performance
Only by understanding customers and their needs can the enterprise achieve excellent communication with customers. When a customer makes a purchase decision, it appears to have purchased a specific product or a certain technology. However, there is a logic behind it that is often overlooked because the product or technology can deliver specific benefits to customers or solve a specific. The understanding is what makes the customers to but it (Kotler, 2000). Early research has shown that customer-driven orientation means that the company has a good understanding of the company's target market and can see the needs of customers for robust and more targeted marketing strategies and tactics (Cooper, 1979).
Customer-driven orientation can enable companies to respond quickly to the changing needs of customers, leading to customer satisfaction. In turn, customer satisfaction can provide a basis for forming a lasting relationship between the company and its customers. The persistence and value of this relationship provide the source of the company's competitive advantage (Morgan and Hunt, 1995). Holack and Lehmann (1988) found that product advantage is positively related to customer purchasing intentions. Effectively responding to customers can improve the relationship with significant customers, increase the difference between the company and competitors, and create unique product advantages. New products with advantages can create more value for customers and solve problems that could not be solved in the past. Problems, or bring customers an unprecedented experience, which can improve customer satisfaction.
2.3.2 Competitor-Driven Orientation and Performance
Competition plays a vital role in corporate strategy and has a more significant impact on innovation strategy and organisational performance (Gatignon and Xuereb, 1997). According to the resource advantage theory (Hunt and Morgan, 1995), the financial performance of a company relative to its competitors is a kind of competitive feedback can encourage enterprises to continue learning. By understanding its advantages or disadvantages in market competition, companies will be more motivated to learn how to build new unique capabilities and how to make full use of existing resources or capabilities to do better than their competitors. Competitor-Driven Orientation help in promoting the improvement of corporate performance. It can be regarded as that competitor-driven companies often use competitors as their reference objects, and therefore identify their advantages and disadvantages. At the same time, competitor-driven companies provide customers with lower-priced or more valuable products to better meet the needs of existing customers than their competitors (Hunt and Morgan, 1995). Porter’s (1980) competitive strategy theory argues that companies often choose low-cost strategies or differentiated strategies to gain a favourable position in the competition, reduce competition risks, and obtain higher profits. It can be regarded as that the competitor-driven orientation enables companies to seek more favourable competitive strategies, which in turn leads to performance improvements.
Furthermore, the improvement of the internal capabilities of an enterprise is also related to the pressure exerted by competitors. Resource theory argues that in a volatile market environment, to cope with competition, companies will find ways to improve and use their existing unique resources and develop new capabilities (Barney, 2001). It can be regarded as that real-time monitoring of competitors will also lead to the improvement and upgrade of corporate capabilities, thereby enhancing corporate performance. Through the above analysis, it can understand the positive effect of competitor-driven orientation on organisational performance from the logical mechanism and can also understand the theoretical basis behind the conclusions of relevant empirical research.
On the whole, driving market orientation can promote the improvement of enterprise performance, that is, ignoring the immediate competitors and customers will cause the enterprise to lose the reference to continuously improve its capabilities and continuously improve the means to meet customer needs. The market behaviour of a company is more often reflected in satisfaction with customers and imitating or surpassing competitors.
2.4 Driving-Market Orientation and Performance
This section will explain on driving-customer orientation and performance and driving-competitor orientation and performance
2.4.1 Driving-Customer Orientation and Performance
Although customer-driven orientation is believed to be able to actively promote corporate performance, researchers believe that customer-driven orientation is more likely to result in performance improvement (Hamel and Prahalad, 1991). This is because compared to companies that gain advantages from current customer knowledge. Those companies that can effectively predict changes in customer needs and cultivate new capabilities based on existing knowledge can generate more lasting competitive advantages. Because driving customer orientation places more emphasis on markets that have not been served by any company, it can open new businesses and gain additional business opportunities and market potential. The expansion of the business area caused by the customer-driven orientation is different from the business expansion caused by the customer-driven orientation. The former can adopt the first-mover strategy to obtain more profit in the new market. Therefore, Day (1999) believes that managers should be aware that the market currently served by the enterprise should be regarded as a part of the total market, and more importantly, they should be good at discovering new, valuable and attractive market segments. Hamel and Prahalad (1991) believe that it is more critical for companies to guide the behaviour of market players by taking the lead in developing new businesses than merely responding to the behaviours of market players because some studies have shown that market leaders can gain lasting market advantages. Kennedy et al. (2003) theoretically explained the reasons why market leaders can obtain huge profits. The effectiveness of distribution channels, the marginal effect of advertising, scale effects, experience and reputation assets can all bring excellent economic benefits to market leaders. At the same time, market leaders also have the priority to choose the most profitable market segments, Market positioning and opportunities to set barriers to entry, the new consumer behaviour characteristics cultivated by market leaders before other companies enter, such as brand loyalty, also provide a guarantee for the success of market leaders. These studies tell us that driving customer orientation plays a significant role in improving organisational performance.
2.4.2 Driving-Competitor Orientation and Performance
Jaworski, Kohli and Sahay (2000) believe that emphasize is needed to companies that drive competition-oriented to help in the shaping of new market structures and market participants' behaviours, so they will use their competitor knowledge and their resources to plan their strategic actions and eliminate directness as much as possible. Competition and commercialization risks of new products. Researchers also believe that driving competitor orientation enables companies to foresee the threats that indirect competitors or all unconventional competitors may pose (Slater and Naver, 1995). In addition, competitor-driven companies can learn the good practices of potential competitors to improve their market operation and management capabilities. That implies, by learning the experience of potential competitors or outstanding companies in other industries to improve the difficulty of potential competitors to enter the industry.
Competitor-oriented companies can better predict the strategic actions of potential competitors and the strategic positioning of potential competitors by identifying the list of potential competitors and mastering their resource characteristics, internal capabilities and strategic intentions. As far as possible, the author will build differentiated advantages to avoid direct conflict. Therefore, it is generally believed that companies that drive competitor orientation are more likely to achieve the purpose of improving their performance.
The literature review covered the organisation performance, marketing performance, marketing innovation and performance metric, market-driven orientation and performance and driven-market orientation and performance.
2.5 Hypothesis and Conceptual Framework
2.5.1 Research Hypothesis
In empirical research, there is a general approach to the methodology of research hypotheses; that is, the research hypotheses are based on the research conclusions of the existing literature on the same or similar issues. Such research conclusions can be based on classical theories and reality perception. The inferences made can also be derived from empirical research results in different research environments. This dissertation will adopt this approach. However, judging from most of the empirical research literature, this approach also has its shortcomings; that is, it can easily lead to partial repeated interpretation and analysis of the context. Therefore, considering that the related content of the literature review mentioned earlier has a detailed review of variables, the composition of variable dimensions and the relationship between variables from the perspectives of theoretical logic and empirical research, this chapter does not affect the premise of understanding the problem. Next, try to reduce repetitive analysis.
Before establishing the research hypothesis, the author will sort out the related concepts based on the explanation of the concept definition in section 2.1-2.4, to facilitate the understanding of the research hypothesis. Regarding organisational performance: This study uses the goal method proposed by Ford and Schellenberg (1982) to define organisational performance as subjective organisational performance relative to competitors and uses the concept of overall performance.
1) Marketing Innovation and Performance
Innovative features can bring product differences and new product advantages, and new product advantages can promote customer adoption of new products and new product success (Holack, 1988). Novelty and value are regarded as essential product differentiation and product advantages. Two aspects as per (Cooper, 1983), are regarded as the key to a company's market performance. Research conducted by Subramanian and Nilakanta (1996) shows that this conclusion does not change due to different industries and regions. At the same time, innovation in marketing methods is also indispensable for improving organisational performance. Because marketing plan innovation can make the differentiated advantages of new products not quickly destroyed by competitors' power (Andrews and Smith, 1996), making new products more attractive to consumers, creative marketing plans are also likely to make companies obtain valuable and differentiated competitive positioning. Empirical research also confirmed the positive impact of marketing strategy innovation on market performance (Menon, 1999).
On the other hand, new products and marketing methods can enable late market entrants to surpass market pioneers by reshaping products and competition rules, or through marketing innovation, to build product strategies and marketing strategies that other competitors cannot imitate, thereby increasing the corporate’s marketing performance and financial performance (Bowman and Gatignon, 2005).
Furthermore, regarding the literature review was mentioned in the section 2.2.3, the immediacy of digital marketing, along with advanced analytical tools, makes it possible for analysts to measure, monitor, and test the success of digital campaigns in real-time, to learn what strategies are most successful. This in turn helps companies achieve higher ROIs and makes for a better consumer experience (SAS Software 2014).
Therefore, the author makes the following hypothesis:
Table 1
|
Hypothesis 1 |
|
H0: There is no relationship between performance appraisal on product innovation and marketing performance. |
|
H1: There is a positive relationship between performance appraisal on product innovation and marketing performance. |
Table 2
|
Hypothesis 2 |
|
H0: There is no relationship between performance appraisal on marketing-method innovation and marketing performance. |
|
H1: There is a positive relationship between performance appraisal on marketing-method innovation and marketing performance. |
Table 3
|
Hypothesis 3 |
|
H0: There is no relationship between performance appraisal on digital marketing innovation and marketing performance. |
|
H1: There is a positive relationship between performance appraisal on digital marketing innovation and marketing performance. |
2) Market Orientation and Performance
Market-driven companies understand their advantages or disadvantages in market competition, so that they can better meet the needs of existing customers and provide customers with lower-priced or more valuable products as much as possible (Hunt and Morgan, 1995). Port (1980) believes that the competitor-driven orientation enables companies to seek more favourable competitive strategies, which in turn leads to performance improvements. The research of Gartignon and Xuereb (1997) shows that competitor-driven orientation can promote the company to make better product positioning. Competitor-driven orientation can prompt the company to discover the changes in the business environment in time to determine whether it needs to adjust product strategies or other marketing strategies to improve corporate performance.
Therefore, the author makes the following hypothesis:
Table 4
|
Hypothesis 4 |
|
H0: There is no relationship between performance appraisal on market-driven orientation and marketing performance. |
|
H1: There is a positive relationship between performance appraisal on market-driven orientation and marketing performance. |
As per section 2.4, driving-market orientation companies will strive for industrial policies that are conducive to their development or establish industry norms that are conducive to their development so that companies can gain more significant development space and higher competitive initiative (Barlow, 2004). At the same time, such enterprises will also strive to break the overall balance between various forces, redefine the roles of participating members, and strive for an active position in the competition. This will not only benefit the company's product innovation but also promote the improvement of corporate performance (Jaworski, Kohli and Sahay, 2000).
Therefore, the author makes the following hypothesis:
Table 5
|
Hypothesis 5 |
|
H0: There is no relationship between performance appraisal on driving-market orientation and marketing performance. |
|
H1: There is a positive relationship between performance appraisal on driving-market orientation and marketing performance. |
3) Supplement for Dynamic Factors of Environmental Characteristics
Environmental characteristics include many aspects, but technological fluctuations, market fluctuations and competition intensity are the three external environmental variables that receive the most attention. Researchers believe that the moderating effect of environmental characteristics will occur in the relationship between market orientation and innovation, and then transferred to organisational performance through product innovation or strategic innovation, or directly adjust the relationship between market orientation and organisational performance (Jawroski and Kohli, 1993).
Increased market volatility, increased competition intensity, or severe technological volatility will make the relationship between market orientation and performance stronger (Jawroski and Kohli, 1993). The research of Ozer (2006) confirmed that both market-driven and market-driven strategic thinking are positively correlated with indicators such as product innovation, new product success rate, and return on assets. Organizational support and environmental characteristics variable market fluctuations and technological fluctuations the introduction of competition and competition intensity as a covariate will strengthen this relationship.
Therefore, the author makes the following hypothesis:
Table 6
|
Hypothesis 6 |
|
H0: There is no relationship between the sensitivity of performance appraisal to market changes and marketing performance. |
|
H1: There is a positive relationship between the sensitivity of performance appraisal to market changes and marketing performance. |
Table 7
|
Hypothesis 7 |
|
H0: There is no relationship between the sensitivity of performance appraisal to technological dynamics and marketing performance. |
|
H1: There is a positive relationship between the sensitivity of performance appraisal to technological dynamics and marketing performance. |
Table 8
|
Hypothesis 8 |
|
H0: There is no relationship between the sensitivity of performance appraisal to increased competition intensity and marketing performance. |
|
H1: There is a positive relationship between the sensitivity of performance appraisal to increased competition intensity and marketing performance. |
In the above hypothesis, the main factors affecting marketing performance will be employed as independent variables in the experimental part. Furthermore, for the dependent variable —— marketing performance, the author will adopt the indicators mentioned in section 2.1.2 and 2.1.3: sales margin, return on assets (ROA), return on investment (ROI), market share, new product success rate and customer satisfaction.
2.5.2 Conceptual Framework
Figure 1

3.0: Methodology
This chapter explains the feasibility of the research method adopted in this article. The research method is developed based on the research onion framework of Sanders et al. (2019), starting from research philosophy to data collection technology, including research-based mixed realism philosophy, deductive methods, case studies, questionnaires and easement sampling technique. In addition, data analysis techniques for quantitative data (descriptive statistics, frequency, correlation, and regression), and techniques for processing qualitative analysis (the analysis of interview content) are explained.
3.1 Research Approach
3.1.1 Mixed Approach
The dissertation will adopt the mixed analysis method including quantitative analysis and qualitative analysis, there was a need to employ the empirical approach in providing a clear understanding of the performance appraisal. The utilisation of the quantitative analysis and qualitative analysis is to enable questionnaire and interview within the enterprise to obtain the status and existence of L'Oréal (China) current performance appraisal plan.
Quantitative analysis collected the cognition and evaluation of marketing performance indicators by employees of the marketing department of L'Oréal China through questionnaires. The survey methods of specific departments of specific enterprises limit the sample size of this questionnaire survey. This survey collected 39 respondents from L'Oréal China's marketing department and conducted quantitative research on them using statistical knowledge. The quantitative analysis in this article uses the rigorous conceptual framework discussed in Chapter 2 to generate valid and reliable findings. However, due to the low sample size and the particularity of the sample characteristics, the results of the quantitative analysis of this thesis may be controversial, so this article conducts a qualitative analysis of interviews. The subject of the interview was an executive from L'Oréal's China Brand Marketing Department. The content of her interview can make the paper analyse marketing performance more comprehensively.
Realist philosophy is the foundation of mixed research. This approach is based on the notion that scientific method may be deployed to ascertain knowledge, and objective reality is independent of human perception. Realism itself may be subdivided into two categories, namely critical realism and direct realism (Kothari, 2004). The former maintains that the world may not be wholly or efficiently described by reference to human cognition or perception (Sanders et al., 2019). Direct realism, conversely, holds that the ‘reality’ of the world is accessible via human reason, and this paradigm is closely intertwined with qualitative research. The present article thus deploys direct realism in the context of research development, while using critical realism as the basis of quantitative research. For the objectives of this article, it is not sufficient to depend exclusively on either qualitative or quantitative methodology. Qualitative research, drawing on interpretivism, is preoccupied with the researcher’s experience or perception of the research object (Saunders et al., 2019). Nonetheless, the credibility of research results may be compromised when the biases or emotions of the researcher may be so readily introduced to a study. Moreover, the results of qualitative studies may not be easy to generalize. In the context of the present article, a large quantity of data samples, collected via qualitative data-collection tools, may not be assembled by a single researcher. This article deploys L’Oréal as a case study, but the consequent results may not necessarily apply to other companies, either in China or abroad. Conversely, quantitative research comprises rigorous methodology, and, being based on positivism, includes a strict research framework. These factors reinforce the credibility of results, but also hinder any attempt to explore variables or pursue insights beyond the research framework (Warren & Karner, 2005).
3.1.2 Deductive approach
In order to achieve the goals of this dissertation, the deductive approach was employed. This method allows one to draw on existing knowledge, in order to explain an observable phenomenon (Saunders et al., 2019). Since findings rest on extant knowledge, they are more likely to be convincing and valid. By deploying a deductive method, the dissertation was able to base its findings on previous research results and on established, credible information. Data were collected, and analysed, according to a coherent and established paradigm. The deductive approach therefore underpins the credibility of the findings of this study. True, the deductive method is not associated with the formulation of ‘new’ theory, but this was not our goal. Furthermore, the deductive approach is economical in terms of time since it directly addresses the research questions. This is especially significant when a timeframe of only three months is available.
Conversely, the inductive approach is primarily associated with the exploration of new theories and perspectives, but such ‘new’ insights are questionable if they lack the support of extant theory. The inductive approach formulates goals or research questions based on observation. Only then is formal research undertaken (Thanh & Thanh, 2015). Nonetheless, in order to formulate the goals and research questions of the present study, it was sufficient to review existing theory.
3.2 Data collection
The dissertation deployed 39 questionnaires for the purpose of data collection. This is the most effective method for qualitative research (Saunders et al., 2019). A questionnaire comprising well-crafted questions can be processed rapidly by statistical-analysis software. (In the present case, primary data were analysed via SPSS.) Questionnaires also have the advantage that they can be offered to a wide range of respondents via the Internet (Saunders et al., 2019). This allows researchers to focus on spread, rather than data collection per se.
The present dissertation used the conceptual framework as the basis for its questionnaire design (Section 2.4). The questionnaire will be shown in Appendix. The design of questions was based on the features of variables, as identified via the framework. The questions were calibrated to a Likert Scale, namely: strongly disagree, disagree, neutral, agree and strongly agree, with these responses numbered from 1 to 5, respectively.
Data regarding respondents’ demographic profiles were collected, pertaining to gender, educational attainment, age, work experience and position. Questions were also formulated in order to interrogate the respondents’ views on the elements of performance appraisal regarding L’Oréal’s marketing. Inter alia, such questions determine whether an individual has sufficient experience of the company to render his/her data worthy of analysis.
The research devised the online questionnaire at Wenjuan.com.cn, and it was generated into a mini programme of WeChat to spread. By convenience sampling technique, the researcher found two internal employees of L’Oréal China and asked them to help spread questionnaires.
3.3 Data Analysis
This dissertation will conduct quantitative and qualitative analysis, respectively. The quantitative analysis covers demographics, frequency, correlation and regression analysis. The qualitative analysis addresses the interview with the senior manager of L’Oréal China.
4.0 Data Analysis
This chapter has two sections that conduct quantitative and qualitative analysis, respectively. The quantitative analysis covers demographics, frequency, correlation and regression analysis. The qualitative analysis addresses the interview with the senior manager of L’Oréal.
4.1 Quantitative Analysis
4.1.1 Demographics Analysis
There are totally 39 participants and demographic distribution is showed in the Table 1. Generally, the demographic distribution of these participants is balanced, which means that the sample has a high level of demographic representation.
Table 9: Demographics Distribution
|
Demographics |
|
Frequency |
Percentage |
|
Gender |
Male |
16 |
41.03% |
|
Female |
13 |
58.97% |
|
|
Age |
18-24 |
4 |
10.26% |
|
25-34 |
33 |
84.62% |
|
|
35-44 |
2 |
5.13% |
|
|
Senior Executive |
1 |
2.56% |
|
|
Middle Manager |
12 |
30.77% |
|
|
Junior Employee |
26 |
66.67% |
|
|
Education Background |
Bachelor |
36 |
92.31% |
|
Master |
3 |
7.69% |
|
|
Ph. D |
0 |
0 |
|
|
Work Experience |
1 year |
1 |
2.56% |
|
1-2 years |
4 |
10.26% |
|
|
3-5 years |
18 |
46.15% |
|
|
6-10 years |
10 |
25.64% |
As Figure 2 shows, the gender distribution is basically balanced, including 23 male and 16 female employees.
Figure 2: Gender Distribution

The age distribution covers the range of 18 to 44 years old. 84.62% of these participants are 25-to-34-year-olds, which are the major human capital supporting innovation, followed by 10.26% of these participants who are 18-to-24-year-olds. Only 5.13% of these participants are 45-to-54-year-olds. Even though this survey did not access those employees who are older than 45 years old, it covered the major human capital supporting innovation, which means that they tended to offer valid data.
Figure 3: Age Distribution

66.67% of these participants are junior employees, followed by 30.77% of middle managers and 2.56% of senior executive. This job position distribution covers employees, middle and senior executive, which is conductive to data validity.
Figure 4: Distribution of Job Position of these Respondents

92.31% of these participants have Bachelor degrees and 7.69% of these participants have Master degrees.
Figure 5: Distribution of Education Background

In terms of work experience, 46.15% of these participants have 3 to 5 years’ experience, followed by 25.64% who have 6 to 10 years’ experience. 10.26% of these participants have 1 to 2 years’ experience. Only 1 respondent has 1-year experience. Therefore, most of these participants have enough work experience to offer valid data.
Figure 6: Distribution of Work Experience of these respondents

4.1.2 Frequency Analysis
The scale of the frequency analysis is showed in the below.
Table 10: Demographics Distribution
|
1 |
Strongly disagree |
|
2 |
Disagree |
|
3 |
Neutral |
|
4 |
Agree |
|
5 |
Strongly agree |
4.1.2.1 Product innovation and Corporate marketing performance.
As figure 7 shows, 22 of these participants agree that L’Oréal’s performance appraisal on product innovation can effectively and accurately show its employees’ real performance and efforts., accounting for 56.41%. 28.21% strongly agree with this statement. Only 6 participants are neutral, accounting for 15.38%. Additionally, the mean of the question reaches 4.13, suggests that most of these participants agree with the statement. The result of the question suggests that L’Oréal’s performance appraisal on product innovation is effective to measure its employees’ work.
Figure 7:

61.54% of these participants agree that L’Oréal’s performance appraisal on product innovation motivates them to develop products contributing to its competitive advantages. Furthermore, 20.51% strongly agree with it. 10.26% of these participants are neutral. 7.69% of these participants disagree with it. Moreover, the mean of the question reaches 3.95. This shows that much more participants agree with the effectiveness of the performance appraisal to product innovation towards competitive advantages. Generally, these employees believe that the performance appraisal on product innovation is effective.
Figure 8:

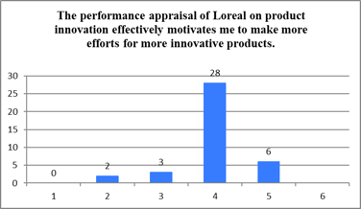
In Figure 8, the question measures the impact of the performance appraisal on employees’ motivations of making more innovative products. 71.79% of these participants agree that the performance appraisal can motivate them to make more efforts for more innovative products. 15.38% of these participants strongly agree with it. On the other hand, 7.69% of these participants are neutral and 5.13% disagree with it. In general, the mean of this question is 3.97. These results that the performance appraisal can improve these employees’ motivations for more innovative products.
Figure 9
The mean of these questions measuring product innovation suggests that L’Oréal generally has a good and effective performance appraisal on product innovation. The performance appraisal can motivate employees to develop products to improve the company’s competitive advantages and be more innovative. More importantly, it can effectively and accurately show these employees real performance and efforts.
Table 11
|
Question Number |
Mean |
|
6 |
4.13 |
|
7 |
3.95 |
|
8 |
3.97 |
4.1.2.2 The innovation of marketing methods and corporate marketing performance.
66.67% of these participants agree that L’Oréal’s performance appraisal on marketing methods can motivate them to make more efforts contributing to the brand’s differentiation. 20.51% strongly agree with it. 12.82% of these participants are neutral. More importantly, no participant disagrees with it. The mean of this question reaches 4.08, showing a high level of agreement. These results show that the performance appraisal can contribute to the brand’s differentiation.
Figure 10

There are totally 87.18% of these participants who agree that the performance appraisal of L’Oréal on marketing methods innovation effectively motivates them to make more efforts for more innovative marketing methods. To be specific, 17.95% of participants strongly agree with it and 69.23% agree with it. Only 1 participant disagrees with it and 10.26% of participants are neutral. The mean of this question reaches 4.03, suggesting that the performance appraisal can contribute to the generation of more innovative marketing methods.
Figure 11

Based on above analysis and the mean of the two questions, it is safe to induce that L’Oréal has good performance appraisals on marketing methods. The performance appraisals can improve the brand’s differentiation and innovativeness of marketing methods.
Table 12
|
Question Number |
Mean |
|
9 |
4.08 |
|
10 |
4.03 |
4.1.2.3 Digital Marketing and marketing performance.
Almost all participants (97.43%) agree that the performance appraisal encourages these employees to find more creative and effective way to deliver marketing messages, including 58.97% agree and 38.46% strongly agree). Only one participant chose neutral accounting for 2.56%. Thus, it is clear that the performance appraisal facilitates creativeness and effectiveness of delivering marketing messages.
Figure 12

89.75% of these participants agree that the performance appraisal encourages these employees to use more innovative technologies, including 61.54% agree and 28.21% strongly agree. 10.26% of these participants are neutral. The mean of this question is 4.18. Generally, these results show the performance appraisal stimulates the use of innovative technologies.
Figure 13

The mean of these questions and the above analysis show that the performance appraisal on digital marketing can effectively encourage employees to enhance creativeness and effectiveness of delivering marketing messages as well as increase the use of innovative technologies.
Table 13
|
Question Number |
Mean |
|
23 |
4.36 |
|
24 |
4.18 |
4.1.2.4 Market-driven orientation on marketing performance.
The mean of this question is 3.95, indicating that more participants agree that the performance appraisal on market-driven orientation encourages these employees to consider more customers’ needs. There are totally 79.49% of these participants who agree with it, including 61.54% agree and 17.95% strongly agree. To be noticed, 17.95% of these participants are neutral and 2.56% of participants disagree with it. Thus, the performance appraisal is conductive to the consideration of customers’ needs.
Figure 14

There are totally 89.74% of all participants who agree that the performance appraisal encourages them to examine customer feedback and then make decisions toward greater customer satisfaction (71.79% agree and 17.95% strongly agree). 5.13% of these participants chose neutral. Meanwhile, other 5.13% of these participants disagree with the statement. The mean of this question is 4.03, indicating that most participants agree with the statement. Thus, the performance appraisal encourages these employees to examine customer feedback and improve customer satisfaction.
Figure 15

The mean of this question is 4.00 showing that most of these participants agree that the performance appraisal motivates me to add product attributes and features in accordance with customer opinions. There are totally 87.18% of these participants who agree with it (69.23% agree and 17.95% strongly agree). 7.69% of these participants are neutral and only 2 participants disagree with it accounting for 5.13%.
Figure 16

There are totally 71.79% of these participants who agree with it including 64.10% agree and 7.69% strongly agree. 2 participants disagree with it accounting for 5.13% and 2 other participants strongly disagree with it. The mean of this question reaches 3.64. This means that the performance appraisal motivates me to consider competitors’ practices.
Figure 17

The mean of this question is 3.95 shows that many participants agree that the performance appraisal encourages me to actively response competitors. There are totally 79.49% participants who agree with it (61.54% agree and 17.95% strongly agree). 7 participants are neutral and only 1 participant disagrees with it. The result shows that the performance appraisal encourages active responsiveness to L’Oréal’s competitors.
Figure 18

The mean of this question is 3.26, which is relatively comparing to other questions. Totally, 61.54% of these participants including 51.28% agree and 10.26% strongly agree. There are 8 participants who disagree with it and 5 participants who strongly disagree with it. This means that the performance appraisal encourages these employees to make more efforts to gain more market knowledge and customer insights.
Figure 19

58.97% of these participants agree that the performance appraisal encourages these employees to make more efforts to contribute the company’s marketing performance.7.69% strongly agree with it. However, 17.95% of these participants disagree it and 7.69% strongly disagree with it. Other 7.69% of these participants are neutral. Generally, the mean of this question reaches 3.41. These results suggest that the performance appraisal on market-driven orientation contributes to L’Oréal’s marketing performance. They reflect that the performance appraisal is effective.
Figure 20

The mean of this question is 3.44. Totally, 64.1% of these participants agree with the statement in Figure 18, including 51.28% agree and 12.82% strongly agree. 10.26% of these participants chose neutral. 7.69% of these participants strongly disagree it and 17.95% disagree with it. These results show the performance appraisal encourages these employees to make more efforts to improve the company’s competition position in the market. In other words, the performance appraisal contributes to the company’s competition position.
Figure 21

Based on the mean in Table 13 and above analysis, this research finds that the performance appraisal of L’Oréal can contribute to customer-driven innovation (including consideration of customer needs, feedback, opinion and insights) and competition-driven innovation (including response to competitors, market knowledge, competition position and marketing performance). Therefore, the company has a good performance appraisal on market-driven innovation.
Table 14
|
Question Number |
Mean |
|
11 |
3.95 |
|
12 |
4.03 |
|
13 |
4.00 |
|
14 |
3.64 |
|
15 |
3.95 |
|
16 |
3.26 |
|
17 |
3.41 |
|
18 |
3.44 |
4.1.2.5 Driving-market orientation and marketing performance.
There are totally 84.62% of these participants agreed that the performance appraisal encourages these employees to make more efforts to change consumption preferences of buyers, including 66.67% agree and 17.95% strongly agree. 10.26% of these participants are neutral and only 2 participants disagree with it. The mean of this question reaches 3.97. These results indicate that the performance appraisal on driving market orientation can increase the consideration of consumption preference. In other words, the performance appraisal intentionally shapes consumption preferences.
Figure 22

In Figure 23, 61.54% of these participants agree that the performance appraisal encourages these employees to make more efforts to shape competition environment. 15.38% of these participants strongly agree with it. On the other hand, two participants strongly disagree with it, accounting for 5.13%. 17.95% of these participants chose neutral. Additionally, the mean of this question is 3.82. These results reflect that the performance appraisal helps the company to shape competition environment.
Figure 23

In Figure 24, 64.10% of these participants strongly agree with the statement and 10.26% agree with it. To be noticed, 25.64% chose neutral and there is no participant who disagree or strongly disagree with it. The mean of this question is 3.85. Thus, the performance appraisal encourages these employees to make more efforts to develop radical innovations that could change industry policy. It is conductive to radical innovations and the capability of the company to change industry policy. Generally, it contributes to the company’s to drive the market.
Figure 24

The mean of this question is 4.03. There are totally 89.74% of participants who agree that the performance appraisal encourages these employees to make more efforts to develop innovations that can improve product and technological standards of the industry (including 74.36% strongly agree and 15.38% agree). Only one participant disagrees with it and three participants are neutral accounting for 7.69%. These results suggest that the performance appraisal facilitate the innovations to drive the market by improving product and technological standards of the industry.
Figure 25

The above analysis and the mean showed in the Table 15 indicate that L’Oréal pays heavy attention to new product development and technical standards to affect the market. Also, it changes consumption preferences by product development. More importantly, L’Oréal takes advantage of its knowledge management to facilitate its competitiveness. The company shapes the industry by guiding the competition and its innovation as well as changing its industrial policy. Generally, L’Oréal has good performance appraisal on driving-market orientation.
Table 15
|
Mean |
|
|
19 |
3.97 |
|
20 |
3.82 |
|
21 |
3.85 |
|
22 |
4.03 |
4.1.2.6 Market changes and marketing performance.
The mean of this question is 4.15 and there are totally 87.18% of participants who agree that the performance appraisal has been changing to adapt to the changing consumers (58.97% agree and 28.21% strongly agree). 12.82% of participants are neural. These results show that that market changes can effectively adapt to the changing consumers.
Figure 26

Totally, 92.31% of these participants agree that L’Oréal understands the impacts of changes in the market, so it adjusts its appraisal accordingly to effectively motivate their work (64.10% agree and 28.21% strongly agree). The mean of this question reaches 4.21. Only 7.69% of these participants are neutral. Therefore, these results reflect that L’Oréal is sensitive to marketing changes, it adjusts its appraisal accordingly to effectively motivate my work.
Figure 27

Based on the mean of these questions and above analysis, the market changes that L’Oréal engaged is high. The company pays attention to changes in the market environment, evaluates the impacts of these on its performance appraisals and change them accordingly.
Table 16
|
Question Number |
Mean |
|
25 |
4.15 |
|
26 |
4.21 |
4.1.2.7 Technological dynamics and marketing performance.
92.31% of these participants agree that the performance appraisal has been changing to adapt to the evolving technological environment (66.67% agree and 25.64% strongly agree). 7.69% of these participants are neutral. The mean of this question is 4.18. Generally, these results show that the performance appraisal can effectively adapt to aggressive technology advancement.
Figure 28

4.1.2.8 Increased competition intensity and marketing performance.
The mean of this question is the highest among all questions, reaching 4.41. Almost all participants (97.44%) agree that the performance appraisal can keep L’Oréal to constantly maintain its competitiveness in this highly vying industry including 53.85% agree and 43.59% strongly agree). Only one participant is neutral. These results indicate that the performance appraisal can effectively ensure L’Oréal’s competitiveness in the highly cosmetics industry.
Figure 29

4.1.2.9 Marketing Performance
The scale of Question 29, 30, 31, 32, 33 and 34 is showed in the below.
Table 17: Scale of these questions
|
1 |
Very low |
|
2 |
Low |
|
3 |
Average |
|
4 |
High |
|
5 |
Very high |
89.74% of these participants believe that L’Oréal’s sales margin is high and 5.13% consider that it is very high. Only 2 participants chose neutral accounting for 5.13%. The mean of sales margin is 4.00 showing that the company has a high sales margin.
Figure 30

87.18% of these participants consider that return on assets of L’Oréal is high and 5.13% believe that it is very high. 7.69% of these participants have a neutral attitude. The mean of ROA reaches 3.97. Therefore, these results reflect that the company has a high ROA.
Figure 31

89.74% of these participants believe that return on investment of L’Oréal is high and 5.13% regard it as very high. Only two participants have a neutral attitude accounting for 5.13%. The mean of ROI is 4.00. Thus, these results show that L’Oréal has a high ROI.
Figure 32

The mean of market share reaches 4.03. There are 92.31% of these participants who agree that L’Oréal has a high level of market share. 5.31% believe that its market share level is very high. Only 2.56% of these participants have a neutral attitude. Generally, these results indicate that L’Oréal has a high level of market share.
Figure 33

The mean of new product success rate is 3.90. 84.62% of these participants believe that the new product success rate of L’Oréal is high. 2.56% regard it as high while 12.82% of these participants consider have a neutral attitude. Based on these results, it is reasonable to induce that the new product success rate is considered as high by L’Oréal’s employees.
Figure 34

Totally, 89.74% of these participants consider that customer satisfaction of L’Oréal is high. 2.56% regards it as very high. However, 7.56% of these participants are neutral and one participant views as low. The mean of customer satisfaction is 3.90. Generally, L’Oréal has a high level of customer satisfaction.
Figure 35

4.1.3 Correlation Analysis
The results of correlation analysis are showed in Table 18 and the output of the correlation analysis from the SPSS analysis is showed in the Appendix. These results are analysed based on Cohen et al. (2007)’s criterion for correlation coefficient.
Table 18
|
Correlation Coefficient |
Strength of Correlation |
|
1.00 |
Perfect |
|
0.70 - 0.99 |
Strong |
|
0.40 - 0.699 |
Moderate |
|
0.1-0.399 |
Poor |
|
0 – 0.099 |
No relationship |
As Table 18 shows, the correlation coefficient of product innovation, innovation of marketing methods, market-driven orientation, market volatility and technical volatility is in the range of 0.1 to 0.399. Therefore, each of them has a poor relationship with marketing performance, respectively. The correlation coefficient of driving-market orientation reaches 0.487, which is in the range of 0.40 to 0.699. Hence, there is a moderate relationship between driving-market orientation and marketing performance. Given that these correlation coefficients are positive, these correlations are positive.
Furthermore, the correlation coefficient of digital analysis and competition intensity is lower than 0.1 and larger than -0.1, which suggests that there is no relationship between digital analysis and marketing performance as well as between competition intensity and marketing performance.
Moreover, the P-value of product innovation, innovation of marketing methods, digital analysis, market changes, technological dynamics and competition intensity are larger than 0.05. Therefore, each of them has an insignificant relationship with market performance, respectively. On the other hand, the P-value of market-driven orientation and driving-market orientation is smaller than 0.05. Thus, each of them has an significant relationship with market performance.
Table 19
|
Hypothesis Number |
Relationship |
Correlation Results |
Status |
|
1 |
Product innovation and marketing performance |
Correlation Coefficient: 0.280 P-value: 0.084 (>0.05) |
Poor relationship H1 is accepted Insignificant |
|
2 |
Innovation of marketing methods and marketing performance |
Correlation Coefficient: 0.141 P-value: 0.392 (>0.05) |
Poor relationship H2 is accepted Insignificant |
|
3 |
Digital marketing and marketing performance |
Correlation Coefficient: 0.02 P-value: 0.904 (>0.05) |
No relationship H5 is rejected Insignificant
|
|
4 |
Market-driven orientation and marketing performance |
Correlation Coefficient: 0.399 P-value: 0.012 (<0.05) |
Poor relationship H3 is accepted Significant |
|
5 |
Driving-market orientation and marketing performance |
Correlation Coefficient: 0.487 P-value: 0.02 (<0.05) |
Moderate relationship H4 is accepted Significant
|
|
6 |
Market changes and marketing performance |
Correlation Coefficient: 0.257 P-value: 0.114 (>0.05) |
Poor relationship H6 is accepted Insignificant |
|
7 |
Technological dynamics and marketing performance |
Correlation Coefficient: 0.121 P-value: 0.463 (>0.05) |
Poor relationship H7 is accepted Insignificant |
|
8 |
Competition intensity and market performance |
Correlation Coefficient: -0.048 P-value: 0.774 (>0.05) |
No relationship H8 is rejected Insignificant |
Additionally, the questions to the variable are showed in the below.
Table 20
|
Question Number |
Variable |
|
Q6,7,8 |
Product innovation |
|
Q9,10 |
Innovation of marketing methods |
|
Q11-18 |
Market-driven orientation |
|
Q19-22 |
Driving-market orientation |
|
Q23-24 |
Digital analysis |
|
Q25-26 |
Market volatility |
|
Q27 |
Technical volatility |
|
Q28 |
Competition intensity |
|
Q29 – 34 |
Marketing Performance |
4.1.4 Regression Analysis
This research adopts uses the following equation to run the regression analysis.
Y (Marketing performance) = α + β (Competition Intensity) + β (Market Driven orientation) + β (Product Innovation) + β (Digital marketing) + β (Innovation of marketing method) + β (Driving market orientation) + β (Technical Volatility) + β (Marketing Volatility)
The results of the regression analysis are showed in the Table 21, 22 and 23. The R value is 0.581, suggesting a moderate relationship between the dependent variable (marketing performance) and the independent variables. The R Square is 0.337 showing that 33.7% of variants in the marketing performance can be predicted by the 8 independent variables. Therefore, 66.3% of variants in the marketing performance cannot be predicted by them.
Table 21
|
Model Summary |
||||
|
R |
R Square |
Adjusted R Square |
Std. Error of the Estimate |
|
|
0.581a |
0.337 |
0.160 |
0.26493 |
|
|
a. Predictors: (Constant), Competition Intensity, Market Driven orientation, Product Innovation, Digital marketing, Innovation of marketing method, Driving market orientation, Technical Volatility, Marketing Volatility |
||||
The P-value in Table 6 is 0.096 which is larger than 0.05. Therefore, the result suggests that the relationship between the independent variables and the dependent variable is insignificant.
Table 22
|
ANOVAa |
||||||
|
|
Sum of Squares |
df |
Mean Square |
F |
Sig. |
|
|
|
Regression |
1.071 |
8 |
0.134 |
1.907 |
0.096b |
|
Residual |
2.106 |
30 |
0.070 |
|
|
|
|
Total |
3.177 |
38 |
|
|
|
|
In Table 23, the P-value of product innovation, innovation of marketing method, market-driven orientation, marketing volatility, digital marketing, technical volatility and competition intensity is larger than 0.05. Therefore, each of them has an insignificant relationship with marketing performance. On the other hand, the P-value of driving market orientation is 0.044, lower than 0.05. Hence, the result suggests that driving marketing orientation has a significant relationship with driving market orientation.
The equation is showed in the below.
Y = 3.46 – 0.119 (Competition Intensity) + 0.044 (Market Driven orientation) – 0.023 (Product Innovation) + 0.303(Digital marketing) + 0.278 (Innovation of marketing method) – 0.155 (Driving market orientation) – 0.026 (Technical Volatility) – 0.157 (Marketing Volatility)
Table 23
|
Coefficientsa |
||||||
|
|
Unstandardized Coefficients |
Standardized Coefficients |
t |
Sig. |
||
|
B |
Std. Error |
Beta |
||||
|
|
(Constant) |
3.460 |
0.447 |
|
7.747 |
0.000 |
|
Product Innovation |
-0.119 |
0.136 |
-0.264 |
-0.875 |
0.388 |
|
|
Innovation of marketing- method |
0.044 |
0.138 |
0.089 |
0.320 |
0.751 |
|
|
Market Driven |
-0.023 |
0.100 |
-0.055 |
-0.227 |
0.822 |
|
|
Driving market |
0.303 |
0.144 |
0.575 |
2.101 |
0.044 |
|
|
Marketing Changes |
0.278 |
0.182 |
0.535 |
1.530 |
0.136 |
|
|
Digital marketing |
-0.155 |
0.153 |
-0.267 |
-1.010 |
0.320 |
|
|
Technical Dynamics |
-0.026 |
0.163 |
-0.050 |
-0.160 |
0.874 |
|
|
Competition Intensity |
-0.157 |
0.120 |
-0.297 |
-1.309 |
0.200 |
|
|
a. Dependent Variable: Marketing Performance |
||||||
4.1.7 Summary of Quantitative Analysis
The findings from the quantitative analysis are summarised in Table 24. The result of these variables’ significance from correlation analysis is consistent with that of regression analysis. Only driving-market orientation has a significant relationship with marketing performance.
Table 24
|
The Independent Variable |
Frequency Analysis |
Correlation Analysis |
Regression Analysis |
|
Product Innovation |
Good
|
Poor relationship Insignificant
|
Insignificant
|
|
Innovation of Marketing Methods |
Good level of innovativeness
|
Poor relationship Insignificant |
Insignificant
|
|
Digital Marketing |
Paying heavy attention |
No relationship
|
Insignificant
|
|
Moderately high level
|
Poor relationship Significant |
Insignificant
|
|
|
Driving-market Orientation |
Good Affecting and guiding the market and competition |
Moderate relationship Significant |
Significant |
|
Market Changes |
High
|
Poor relationship Insignificant |
Insignificant
|
|
Technological Dynamics |
High
|
Poor relationship Insignificant |
Insignificant
|
|
Competition Intensity |
High |
No relationship Insignificant |
Insignificant
|
4.2 Qualitative Analysis
This part analyses the interview from the Senior brand marketing manager of Consumer Product Division, L’Oréal China.
4.2.1 Product Innovation and Marketing Method Innovation
The respondent said, ‘performance evaluation on innovation is equally separated and examines both R&D and marketing department’.
This means that R&D and marketing department takes 50% of responsibilities for innovation in performance evaluation. Both managers of R&D and marketing departments have KPIs for innovation. In other words, L’Oréal pays attention equal to product and marketing innovation .
The respondent said, ‘…the top one influencer, Li Jiaqi was cultivated jointly by L’Oréal and Alibaba Group…’.
However, the respondent did further discuss product innovation. She highlighted L’Oréal’s marketing method innovation focusing on online marketing and Key Opinion Leader (KOLs) and live steaming innovation. L’Oréal developed the innovative online marketing approach that combines the influence of KOLs and live steaming. In this approach, KOLs use live steaming to expand their influence and conduct personal sells. The respondent implies that L’Oréal developed this innovative approach and has been holding leading position.
‘The marketing methods of L’Oréal change in accordance with consumers’ habits and lifestyle’, according to the respondent.
This means that L’Oréal has innovation for its marketing to adapt to changes in consumers’ habits and lifestyle. Its marketing method innovation considers changes in consumers.
4.2.2 Driving-marketing Versus Market Driving Orientation
‘L’Oréal is more inclined to driving market orientation, …. For example….LiJiaqi… jointly by L’Oréal and Alibaba Group’, according to the respondent.
The respondent directly and clearly pointed out the marketing strategy of L’Oréal focusing on driving marketing orientation. She took the example of the innovation on the model of KOLs and live steaming. This model has become a phenomenon in Chinese e-commerce market. This means that L’Oréal has been shaping the industry, guiding it and strongly affecting competition environment. Furthermore, L’Oréal has been maintaining strong and deep partnership with Alibaba Group. The partnership allowed L’Oréal to develop and implement the innovative model of KOLs and live steaming, which also is the strong evidence of its marketing method innovation.
‘L’Oréal’s marketing focus has shifted from traditional channel to online channels including Tmall, JD mall, Tik Tok, live steam and online TV. This shift was coordinated based on consumer habits.’ according to the respondent.
‘The marketing methods of L’Oréal change in accordance with consumers’ habits and lifestyle’, according to the respondent.
On above, there are evidences suggesting that L’Oréal also has market driven innovation. The respondent revealed that L’Oréal has been switching its marketing focus from offline to online channels including Tmall, JD mall, Tik Tok, live steam and online TV. This switch was pushed by the changes in consumers’ habits and lifestyle.
The respondent said, ‘consumers have been moving from online shopping mall along with the increasing popularity and prevalence of social media in the past 5 years’ and ‘Consumers have changed the habit of going supermarket and/or watching TV after their work at night’.
This statement shows that L’Oréal has been aware of market trend and then drive the market. It understood the change in consumer behaviour, pattern and habit from going to supermarket and watching TV to social media and online shopping.
4.2.3 Technological Dynamics
‘L’Oréal measures its market share in e-commerce channel, Tik Tok channel, Weibo channel and other digital channels’, the respondent said.
These words indicate that L’Oréal understands technological impact on its marketing channels, so it has performance evaluation on each of these digital channels. It pays heavy attention to every important digital channel including e-commerce (Tmall, JD Mall, etc.), Tik Tok, Weibo and so on.
‘L’Oréal’s marketing…to online channels including Tmall, JD mall, Tik Tok, live steam and online TV…’, the respondent said.
This reflects that L’Oréal engages in important e-commerce platforms in China.
‘Even though marketing method has been transforming to digitalisation, the principle of the performance appraisal is unchanged.’, the respondent said.
This statement reflects that L’Oréal’s performance appraisal maintains the principle of its performance appraisals. In other words, details of its performance appraisal have been changed.
The respondent further explains, ‘at present, market share as an index of performance appraisal is more specific. The company measures its market share in e-commerce (Tmall, JD mall, etc.), Tik Tok, Weibo and so on. Other performance appraisals also follow this pattern.’
The respondent reveals that L’Oréal changes its performance appraisal to measure its innovation performance in digital platforms. In other words, its performance appraisal is changed to adapt to technological changes and its own shifts in marketing focus.
4.2.3 Performance Evaluation
‘Financial indexes such as the increases in sales revenue is prioritised in performance evaluation and then non-financial indexes including customer satisfaction and brand image are suggested’, the respondent said.
Based on the statement of the respondent, L’Oréal focused on financial indexes to directly examine the financial performance brought by its innovation. Then, it considers customer satisfaction, brand image and other non-financial indexes. It may focus on short-term performance of innovation because customer satisfaction, brand image and other non-financial indexes tend to affect sales revenue in longer term.
‘…performance measurement is specific….’, the respondent said.
L’Oréal’s performance measurement is very specific that can evaluate performance in a full and detailed angle.
5.0 Discussion
What is performance measuring system of L’Oréal for innovation?
Based on the qualitative analysis, this research finds that the performance measuring system focuses on financial indexes including sales revenue, profits, etc. and then considers non-financial indexes including market share, customer satisfaction and so on. The quantitative analysis shows that the performance measuring systems can contribute to both financial performance (ROI and ROA) and non-financial performance (market share, new product success and customer satisfaction), given that the regression equation shows a moderate relationship between those dependent variables and independent variable. These findings are consistent with Kaplan and Norton (1990)’s argument that operation performance of an organisation is related with finance (ROI and economic value) and marketing performance (customer satisfaction, retention and market share). Furthermore, many scholars highlight the importance of measuring financial performance by ROI and ROA (Dess and Robinson, 1984; Venkatraman and Ramanujam, 1986). L’Oréal prioritises the measurement of financial performance in front of non-financial performance, which can be explained by Jan and Victor (2019)’s argument that using financial information to measure organisational performance is more comparable.
Moreover, this research finds that L’Oréal also uses non-financial indexes to measure its market performance, which can be explained by Lee (2005)’s argument that financial indicators are unable to fully reflect the operating conditions of enterprises when market-oriented research is further developed.
Based on the quantitative analysis, this research finds that L’Oréal’s performance measuring system can effectively measure the following important variables including product innovation, marketing method innovation, market-driven orientation, driving-market orientation and digital marketing. Also, it finds that the performance measuring system is adapted to market changes and technological dynamics. These finds are supported by previous studies.
This research finds that L’Oréal’s performance appraisals on product innovation moderately affects marketing performance. This is supported by Subramanian and Nilakanta (1996)’s argument that product innovation has a relationship with organisational performance, and it is important to use performance appraisals to measure product innovation.
The result of the research shows that L’Oréal’s performance appraisals on marketing method innovation moderately affects marketing performance. This finding is consistent with Andrew and Smith (1996) who highlight the importance of marketing method innovation. Meanwhile, Menon et al. (1999) argue the connection between marketing method innovation and organizational performance, which also supports the finding.
The result indicates that L’Oréal’s performance appraisals on market-driving orientation moderately affects marketing performance. Also, it finds that the performance appraisals can effectively measure both customer-driven orientation and competition-driven orientation. The importance of customer-driven orientation is supported by Cooper (1979), Kotler (2000) and Morgan and Hunt (1999). Many previous studies imply the prominent role of competition-driven orientation (Barney, 1991; Gatignon and Xuereb, 1997; and Hunt and Morgan, 1995)
This research finds that L’Oréal’s performance appraisals on driving market orientation moderately affects marketing performance. This finding is consistent with Eving and Matanda (2006) who highlight that customer-driven orientation is more likely to result in performance improvement.
The research finds evidences supporting that L’Oréal’s performance appraisals on digital marketing moderately affects marketing performance. This finding is supported by many previous studies suggesting the importance of digital marketing (Chaiyasit, 2019 and Jan and Victor, 2019).
Furthermore, L’Oréal’s performance appraisals can adapt to changes in the market and thus moderately affects marketing performance. Jawroski and Kohli (1993) explain the importance of considering market changes and technological dynamics. Moreover, L’Oréal’s performance appraisals can adapt to technological changes and thus moderately affects marketing performance, which is supported by Capon (1990) who underlines the importance of considering technological strategy.
Based on above analysis, L’Oréal’s performance measuring system considers technological dynamics and changes in the market and then make adjustment to adapt to these changes. The company timely adjust its performance measuring system to maintain the effectiveness of the system in motivating its employees to protect and develop its competitiveness. Furthermore, the system effectively measures product innovation, marketing methods innovation, market-driving orientation, driving-market orientation, digital marketing and market changes.
This research also finds that the company measures performance in a very specific way. Secondly, the company pay equally attention to product innovation and market innovation.
How to develop effective marketing performance measuring system in the innovative industry (Chinese cosmetics)?
Based on the findings of this research, effective marketing performance measuring system in high innovative industry of Chinese cosmetics must accurately evaluate product innovation, marketing methods innovation, market-driving orientation, driving-market orientation, digital marketing and market changes. Especially, the system has to pay attention to driving-market orientation. Meanwhile, the system has to be upgraded timely and effectively to adapt to changes in technological and market environment. Moreover, the system should prioritise financial performance and also consider non-financial performance. Evaluating financial performance is very direct and allows managers to make comparison. The system should measure ROI, ROA and sales revenue. Also, assessing non-financial performance is prominent to facilitate market performance. The system can measure the following indexes: market share, new product success rate and customer satisfaction.
Moreover, the system should be able to measure performance in a very specific way. It also needs to pay equal attention to product innovation and market innovation. It can make product innovation department to take 50% responsibility of market performance and then give the rest responsibility to market innovation department.
6.0 Conclusions
6.1 Summary of Findings
This research finds that the performance measuring system of L’Oréal emphases on financial indexes including sales revenue, profits, etc. and then measures non-financial indexes including market share, customer satisfaction and so on. The performance measuring system effectively evaluates the following important variables including product innovation, marketing method innovation, market-driven orientation, driving-market orientation and digital marketing. Also, it finds that the performance measuring system is adapted to market changes and technological dynamics. The system covers product innovation, marketing methods innovation, market-driving orientation, driving-market orientation, digital marketing and market changes. It measures performance in a very specific way and pay equal attention to product innovation and market innovation. More importantly, the result of the research shows that the performance measuring system of L’Oréal can effectively improve market performance.
Based on the analysis of the performance measuring system in L’Oréal, this research has the following recommendations to other players in the industry to address innovation issues. Useful marketing performance measuring system in the industry must effectively assess product innovation, marketing methods innovation, market-driving orientation, driving-market orientation, digital marketing and market changes. It must measure performance in a very specific way and pay equally attention to product innovation and market innovation. Furthermore, the system needs to prioritise financial performance by measuring ROA, ROI and sales revenue and then consider non- financial performance by assessing customer satisfaction, new product success rate, et al.
6.2 Limitations and Recommendations for Further Research
This dissertation is constricted by its research methodologies. It adopted case study as its research strategy resulting in a lower generalisation and representativeness of its finding. Therefore, further research is advised to use survey based on positivism to find empirical evidences supporting the generalisation and representativeness of its finding. It can adopt survey to collect data from many L’Oréal’s companies to seek out those empirical evidences. Also, further research can increase the generalisation of the findings to all innovative industries by conducting surveys and using empirical evidences.
The regression analysis shows that 66.3% of variants in the marketing performance cannot be predicted by those independent variables. Therefore, further research should focus more on qualitative data and analysis to explore out the rest of variables affecting marketing performance. The effective performance appraisal system should attach importance to them.
This research has collected primary data from L’Oréal’s employees. Further research can gather primary data from consumers and its customers to measure its marketing performance.
Bibliography
Appendix – the Results of Correlation Analysis
|
Correlations |
|||
|
|
Marketing Performance |
Product Innovation |
|
|
Marketing Performance |
Pearson Correlation |
1 |
.280 |
|
Sig. (2-tailed) |
|
.084 |
|
|
N |
39 |
39 |
|
|
Product Innovation |
Pearson Correlation |
.280 |
1 |
|
Sig. (2-tailed) |
.084 |
|
|
|
N |
39 |
39 |
|
|
Correlations |
|||
|
|
Marketing Performance |
Innovation of marketing method |
|
|
Marketing Performance |
Pearson Correlation |
1 |
.141 |
|
Sig. (2-tailed) |
|
.392 |
|
|
N |
39 |
39 |
|
|
Innovation of marketing method |
Pearson Correlation |
.141 |
1 |
|
Sig. (2-tailed) |
.392 |
|
|
|
N |
39 |
39 |
|
|
Correlations |
|||
|
|
Marketing Performance |
Market Driven |
|
|
Marketing Performance |
Pearson Correlation |
1 |
.399* |
|
Sig. (2-tailed) |
|
.012 |
|
|
N |
39 |
39 |
|
|
Market Driven |
Pearson Correlation |
.399* |
1 |
|
Sig. (2-tailed) |
.012 |
|
|
|
N |
39 |
39 |
|
|
*. Correlation is significant at the 0.05 level (2-tailed). |
|||
|
Correlations |
|||
|
|
Marketing Performance |
Driving market |
|
|
Marketing Performance |
Pearson Correlation |
1 |
.487** |
|
Sig. (2-tailed) |
|
.002 |
|
|
N |
39 |
39 |
|
|
Driving market |
Pearson Correlation |
.487** |
1 |
|
Sig. (2-tailed) |
.002 |
|
|
|
N |
39 |
39 |
|
|
**. Correlation is significant at the 0.01 level (2-tailed). |
|||
|
Correlations |
|||
|
|
Marketing Performance |
Marketing Volatility |
|
|
Marketing Performance |
Pearson Correlation |
1 |
.257 |
|
Sig. (2-tailed) |
|
.114 |
|
|
N |
39 |
39 |
|
|
Marketing Volatility |
Pearson Correlation |
.257 |
1 |
|
Sig. (2-tailed) |
.114 |
|
|
|
N |
39 |
39 |
|
|
Correlations |
|||
|
|
Marketing Performance |
Digital marketing |
|
|
Marketing Performance |
Pearson Correlation |
1 |
.020 |
|
Sig. (2-tailed) |
|
.904 |
|
|
N |
39 |
39 |
|
|
Digital marketing |
Pearson Correlation |
.020 |
1 |
|
Sig. (2-tailed) |
.904 |
|
|
|
N |
39 |
39 |
|
|
Correlations |
|||
|
|
Marketing Performance |
Technical Volatility |
|
|
Marketing Performance |
Pearson Correlation |
1 |
.121 |
|
Sig. (2-tailed) |
|
.463 |
|
|
N |
39 |
39 |
|
|
Technical Volatility |
Pearson Correlation |
.121 |
1 |
|
Sig. (2-tailed) |
.463 |
|
|
|
N |
39 |
39 |
|
|
Correlations |
|||
|
|
Marketing Performance |
The rising Competition Intensity |
|
|
Marketing Performance |
Pearson Correlation |
1 |
-.048 |
|
Sig. (2-tailed) |
|
.774 |
|
|
N |
39 |
39 |
|
|
The rising Competition Intensity |
Pearson Correlation |
-.048 |
1 |
|
Sig. (2-tailed) |
.774 |
|
|
|
N |
39 |
39 |
|
Appendix – Questionnaire
Dear Sir or Madam,
I am an MSc student in the Marketing subject of Management School, Queen’s University Belfast. Currently I am undertaking a marketing-performance related dissertation, which involves empirical research on L’Oréal China, the leading cosmetic group worldwide, to explore how to develop the marketing performance measuring system in the marketing innovation environment. The purpose of this research is to increase the understanding of this issue with your help, to contribute to the academic field of marketing performance management.
I hope you can spare about 5 minutes to answer the questions in this research questionnaire. Your responses are anonymous and will be kept completely confidential. All information will be used only for the purposes of academic research. All data will be safely stored during the research process and destroyed after the research is completed.
The questionnaire has been reviewed by experts and proves that it will not involve the confidentiality of the enterprise, and the design is reasonable. If you have any issue during the answer process, please contact me.
Thank you for your assistance and support.
Management School of Queen’s University Belfast
Wenyan Zhang
wzhang19@qub.ac.uk
25. Aug. 2020
Q1. Gender
Male / Female / Prefer Not to Say
Q2. Age
18-24 / 25-34 / 35-44 / 45-54 / 55-64 / 65+
Q3. Your Position
Senior Executive / Middle Manager / Junior Employee
Q4. Education
Bachelor / Master / Ph. D
Q5. Work Experience
<1 year / 1-2 years / 3-5 years / 6-10 years / >10 years
Q6. The performance appraisal of L’Oréal on product innovation can effectively and accurately show my real performance and efforts.
Strongly disagree Disagree Neutral Agree Strongly Agree
Q7. The performance appraisal on product innovation motivates me to develop products contributing to the company’s competitive advantages.
Strongly disagree Disagree Neutral Agree Strongly Agree
Q8. The performance appraisal of L’Oréal on product innovation effectively motivates me to make more efforts for more innovative products.
Strongly disagree Disagree Neutral Agree Strongly Agree
Q9. The performance appraisal of L’Oréal on marketing methods innovation can effectively and accurately show my real performance and efforts.
Strongly disagree Disagree Neutral Agree Strongly Agree
Q10. The performance appraisal of L’Oréal on marketing methods innovation effectively motivates me to make more efforts for more innovative products.
Strongly disagree Disagree Neutral Agree Strongly Agree
Q11. The performance appraisal encourages me to consider more customers’ needs.
Strongly disagree Disagree Neutral Agree Strongly Agree
Q12. The performance appraisal encourages me to examine customer feedback and then make decisions toward greater customer satisfaction.
Strongly disagree Disagree Neutral Agree Strongly Agree
Q13. The performance appraisal motivates me to add product attributes and features in accordance with customer opinions.
Strongly disagree Disagree Neutral Agree Strongly Agree
Q14. The performance appraisal motivates me to consider competitors’ practices.
Strongly disagree Disagree Neutral Agree Strongly Agree
Q15. The performance appraisal encourages me to actively response competitors.
Strongly disagree Disagree Neutral Agree Strongly Agree
Q16. The performance appraisal encourages me to make more efforts to gain more market knowledge and customer insights
Strongly disagree Disagree Neutral Agree Strongly Agree
Q17. The performance appraisal encourages me to make more efforts to contribute the company’s marketing performance.
Strongly disagree Disagree Neutral Agree Strongly Agree
Q18. The performance appraisal encourages me to make more efforts to improve the company’s competition position in the market.
Strongly disagree Disagree Neutral Agree Strongly Agree
Q19. The performance appraisal encourages me to make more efforts to change consumption preferences of buyers.
Strongly disagree Disagree Neutral Agree Strongly Agree
Q20. The performance appraisal encourages me to make more efforts to shape competition environment
Strongly disagree Disagree Neutral Agree Strongly Agree
Q21. The performance appraisal encourages me to make more efforts to develop radical innovations that could change industry policy.
Strongly disagree Disagree Neutral Agree Strongly Agree
Q22. The performance appraisal encourages me to make more efforts to develop innovations that can improve product and technological standards of the industry.
Strongly disagree Disagree Neutral Agree Strongly Agree
Q23. The performance appraisal encourages me to find more creative and effective way to deliver marketing messages.
Strongly disagree Disagree Neutral Agree Strongly Agree
Q24. The performance appraisal encourages me to use more innovative technologies.
Strongly disagree Disagree Neutral Agree Strongly Agree
Q25. The performance appraisal has been changing to adapt to the changing consumers.
Strongly disagree Disagree Neutral Agree Strongly Agree
Q26. L’Oréal understands the impacts of changes in the market, so it adjusts its appraisal accordingly to effectively motivate my work.
Strongly disagree Disagree Neutral Agree Strongly Agree
Q27. The performance appraisal has been changing to adapt to the evolving technological environment.
Strongly disagree Disagree Neutral Agree Strongly Agree
Q28. The performance appraisal can keep L’Oréal to constantly maintain its competitiveness in this highly vying industry.
Strongly disagree Disagree Neutral Agree Strongly Agree
Compared with other competitors, L’Oréal China…
Q29. Sales Margin
|
1 |
2 |
3 |
4 |
5 |
|
Very Low |
|
|
|
Very High |
Q30. Return on Assets
|
1 |
2 |
3 |
4 |
5 |
|
Very Low |
|
|
|
Very High |
Q31. Return on Investment
|
1 |
2 |
3 |
4 |
5 |
|
Very Low |
|
|
|
Very High |
Q32. Market Share
|
1 |
2 |
3 |
4 |
5 |
|
Very Low |
|
|
|
Very High |
Q33. New Product Success Rate
|
1 |
2 |
3 |
4 |
5 |
|
Very Low |
|
|
|
Very High |
Q34. Customer Satisfaction
|
1 |
2 |
3 |
4 |
5 |
|
Very Low |
|
|
|
Very High |