English
 Chinese

Impact of Innovation Strategies on Organisational Performance in Chinese Fresh Food Retailing Segment
Abstract
The aim of this research is to examine causal relationship between innovation strategy and organisational performance in SMEs of Chinese fresh food retailing industry. It focuses on three innovation strategies including market-led innovation, technology-led innovation and open innovation. The purpose of the research is to identify an effective innovation strategy for these SMEs to solve their challenges including high waste, high transportation costs, etc.
This research finds no research studying the impact of innovation strategy on organisational performance in Chinese SMEs. Chinese fresh food online retailers have a very different context and a variety of challenges which tend to need technology innovation to solve high waste and prediction issues. More importantly, there are two contrasting viewpoints about the impact of market-led and technology-led innovation in SMEs. Furthermore, this research plans to recommend Chinese SMEs with fresh food retailing business what innovation strategy they should adopt to improve their organisational performance and grasp the rising demands in the industry.
Based on literature review, this research designs the conceptual framework: the independent variables include market-led innovation, technology-led innovation and open innovation and the dependent variable is organisational performance.
Based on positivism, this research used quantitative research and deductive approach and collected 179 questionnaires by convenience sampling technique. This used cross-sectional time horizon and thus only gathered primary data for once. Also, the data was analysed by regression, correlation and frequency analysis.
This research argues that open innovation is the best strategy for Chinese SMEs. It finds that market-led innovation strategy has a weaker impact than technology-led innovation strategy. Open innovation has the strongest impacts. Firm size has no impact, but firm ownership is a mediating factor. Using open innovation is suggested to these SMEs. Further research can find out the specific activities under open innovation strategy can be used by these SMEs.
1.1.2 Rising fresh food online retailing
1.1.3 Challenges in fresh food e-commerce
1.1.6 Opportunities and Challenges for SMEs
1.3 Research Aims, Purpose, Objectives and Questions
2.1.1 Market-led innovation strategy
2.1.2 Technology-led innovation strategy
2.3 Innovation Strategy and Organisational Performance
2.4 Critical Appraisal of Relevant Research
2.5 Chinese Fresh Food Retailing Market
3.5 Cross-sectional Time horizon
3.7 Convenience Sampling Technique
4.2 Demographics and Business Operation
4.5.1 Market-let, Technology-let and open innovation
4.5.4 Comparison of Firm Ownership
6.2 Recommendations for Further Research
1.0 Introduction
1.1 Research Background
1.1.1 Innovation Strategy
Market-led and technology-led innovation are two important innovation strategies, whereas they have different focus (Brem and Voigt, 2008). Technology-led innovation focuses on using R&D and technologies to develop differentiated products to win a market, whereas market-led innovation focuses on customer demands and competitors’ strategy to offer superior value so as to gain competitive advantages (Beyene et al., 2016).
At present, Industry 4.0 technologies such as AI and big data are promised to change the retail industry. Under the pressure of new technologies and the new retailing trend, it seems that SMEs have to use these technologies and conduct technology-led innovation even though they can be risky and costly. It is challenging for SMEs to choose an effective innovation strategy to grasp the rising demand for fresh food delivery. A less effective innovation strategy could result in organisational failure.
Open innovation could be a solution for SMEs because it helps SMEs to use external capabilities and resources to achieve innovation when most of them are restricted by their small size and insufficient resources.
1.1.2 Rising fresh food online retailing
Fresh food online retailing businesses in mainland shows a sharply growing trend especially during the outbreak of Covid-19. Even though Chinese online retailing has been fast growing, e-commerce giants have not fully exploited the fresh food online retailing business yet because of many reasons. Online retailing of fresh foods faces high transportation costs and high waste (Delfmann et al., 2011). However, due to the burst of Covid-19, many Chinese consumers have got used to purchase fresh food via the internet, leading to the exploding demands for online fresh foods (Zhuoqiong, 2020).
Meanwhile, with the rise of Chinese middle-class population, there are increasingly more customers who demand high-end seafood especially those imported. Chinese views seafood as high-end foods showing their social status and wealthy lifestyle (Gies, 2018). They tend to show off their seafood meal in social media (Gies, 2018). More importantly, Chinese people strongly believe in dietetic invigoration, which means that eating right food can prevent diseases and facilitate health. Seafood is viewed as great nutrition and benefits for health (Allison, 2018). However, it hard for most Chinese consumers to purchase high-end fresh food. Living in a fast lifestyle, Chinese middle and upper class have strong demand for online retailing of high-end fresh food. Sea food consumption increased from 3.1 kg per household in 1985 to 11.4 kg in 2016 (Crona et al., 2020). Crona et al. (2020) predict that the demand for seafood will boom in 2030 and rely more on importing. Furthermore, Crona et al. (2020) find that Chinese consumers are demanding alive seafood imported by airline such as Boston lobster.
1.1.3 Challenges in fresh food e-commerce
However, many online retailing giants are not very successful in exploring Chinese fresh food delivery market, including Alibaba Group, JD mall, SF express. Meanwhile, McKinney’s survey including 5000 respondents find that no large retailer in China is viewed as fresh-food winner (Kang et al., 2019). Alibaba Group had an ambitious project and investment known as Hema fresh food. Hema combines both online retailing and physical and engages in Tier one cities including Beijing and Shanghai. Customers can purchase fresh food and request restaurants to process and cook the fresh food in Hema. Also, Hema offers highly digitalised customer experience and full services featuring robots, apps and big data (Saiidi, 2018). It defines new retailing in China by the following features: personalised shopping supported by AI, digital price tags, scanning QR codes to buy, fast delivery, stores as delivery hubs, high customer experience, and robots for automating services (Mckinnon, 2019). However, Hema also faces high operating costs, low revenue, low profitability and high waste issues (Saiidi, 2018). Meanwhile, SF express has been the largest logistics and express provider in China, who reasonably has strong capabilities of cost control over fresh food supply. However, its fresh food retailing business had been gloomy until it closed its retailing shop in 2019 (Kot, 2019). Delfmann et al. (2011) conclude that the challenges in fresh food online retailing including high transportation cost, high death rate of alive foods such as crab, low trust, high wastes, difficulty to predict demand, and highly flexible prices of seafood.
1.1.4 New Retailing
Along with Hema, a wave of new retailing is rising in China. According to USDA. Gov (2019), the concept of new retailing has the following features: 1) new retailing place covering in-store restaurants and bakeries to improve customer experience, reduce costs of customers, and offer convenience; 2) product and store placement are developed and organised based on big data to meet customer expectations; 3) competition is intensive because of data-driven innovations; 4) community and convenience stores are growing fast; 5) retailers use Apps and other digitalised techniques to offer innovative purchasing experience; 6) variety of delivery choices increase value-added services; and 7) retailers are developing private labels.
1.1.5 Customer Demands
The Mckinsey survey illustrates the demands of Chinese consumers in fresh food market (Kang et al., 2019). The strongest factor affecting their purchase decision is quality, followed by convenience. Developing distinctive online to offline model that offer unique customer experience is advised (Kang et al., 2019). The concept of retail-tainment is rising in China, which means that customers can get entertainment in stores. Many stores have been developing entertainment for family. 64% of Chinese consumers go to shop with family to spend quality family time (Kang et al., 2019). Meanwhile, the food retailing market is pushed by two drivers (USDA.Gov, 2019). Firstly, customers’ demands for conveniences, specialisation and image are growing. Second one is the economic growth of tier two and three cities.
1.1.6 Opportunities and Challenges for SMEs
Given that there is no dominator in the market, customers demand for convenience and convenience and community stores are rising, it is safe to say that SMEs still have opportunity to grasp the rising demands for fresh food retailing services. It is debatable that SMEs have less resources for R&D and technological innovation than online retailing giants such as Alibaba. Nevertheless, they still can adopt technologies effectively to improve their service quality or even change their business model to meet customer demands.
1.2 Research Significance
This research is significant that make academic contributions. It finds no research studying the impact of innovation strategy on organisational performance in Chinese SMEs. Salavou et al. (2004) study the impact of organisational innovation in Greek SMEs and Hervas-Oliver et al. (2014) study the relationship between process innovation strategy and innovation performance in Spanish SMEs. The two researches support market-led innovation. However, Chinese fresh food online retailers have a very different context and a variety of challenges which tend to need technology innovation to solve high waste and prediction issues. More importantly, there are two contrasting viewpoints about the impact of market-led and technology-led innovation in SMEs. Salavou et al. (2004) and Hervas-Oliver et al. (2014) support market-led innovation in SMEs. On the other hand, many scholars show empirical evidences supporting that both technology-led and market-led innovation strategy positive affect product innovation performance (Al-Ansari et al., 2013; and Delgado et al., 2013). Therefore, it is important for this dissertation to cover the research gap about the impact of market-led / technology-led innovation in Chinese fresh food retailing industry. Furthermore, there is another research about open innovation: Stanislawski (2020) studies open innovation in Poland’s SMEs. However, this research does not cover the research gap about the impact of open innovation on innovation performance in SMEs.
Furthermore, this dissertation can make managerial contributions. The expected results can recommend Chinese SMEs with fresh food retailing business what innovation strategy they should adopt to improve their organisational performance and grasp the rising demands in the industry. Chinese SMEs can design their innovation strategy based on the results of this research to improve organisational performance. These results are helpful for them to grasp the growing fresh food retailing market.
1.3 Research Aims, Purpose, Objectives and Questions
The aim of this research is to examine causal relationship between innovation strategy and organisational performance in SMEs of Chinese fresh food online retailing industry. It focuses on three innovation strategies including market-led innovation, technology-led innovation and open innovation. The purpose of the research is to identify an effective innovation strategy for these SMEs to solve their challenges including high waste, high transportation costs, etc. The expected result of this research is to offer these SMEs recommendations about how effectively use innovation to improve organisational performance. The result also can help them to grasp the rising demand in Chinese fresh retailing industry.
Based on the research’s aim and purpose, the research objectives are identified:
· To critically discuss reliable theories and knowledge in terms of innovation strategy and its impacts on organisational performance
· To analyse the impact by analysing primary data
· To discuss the results of the data analysis with theories and knowledge to conclude findings and make recommendations
The Core Research
What innovation strategy Chinese SMEs in fresh food retailing industry should use to improve their organisational performance to grasp the rising demands?
1.4 Research Plan
This research plans to clarify its objectives, purposes and questions and analyse market environment of Chinese fresh food industry in this chapter. Then, it critically discusses literature related with innovation strategy (market-led innovation, technology-led innovation and open innovation), innovations in SMEs and Chinese fresh food industry. Meanwhile, it builds a conceptual framework. Also, this research justifies the choices of its research methodologies including quantitative approach, survey, questionnaires and convenience sampling in the Chapter Three. It analyses results in the Chapter four by regression, correlation and frequency analysis. Next, it discusses the results of these analyses with the literature review. Finally, it makes conclusions and recommendations for future research.
2.0 Literature Review
This chapter critically discusses literature related with the following aspects: market-led and technology-led innovation strategy, open innovation, innovation in SMEs, the relationship between innovation strategy and organisational performance, and Chinese fresh food retailing industry. Also, it develops a conceptual framework based on previous studies.
2.1 Innovation Strategy
2.1.1 Market-led innovation strategy
Both market-led and technology-led innovation aim to gain superior innovation performance by improving organisational capabilities (Saeed et al., 2015). Market-let innovation strategy targets at those neglected customer demands and products and services with a low customer satisfaction, fulfil their demands and achieve high level of customer satisfaction by focusing on innovation (Ende and Dolfsma, 2005). Brem and Voigt (2009) highlight that market-let innovation has less R&D costs and addresses fewer technologies uncertainties and lower level of risk.
Market-led innovation strategy positively affect organisational performance because it allows a company to focus on customer needs and effectively response to its competitors (Paladino, 2009 and Calantone et al., 2002). Calantone et al. (2002) find that organisations intentionally focus on external environment to identify innovation idea so as to have better performance than their competitors. Market-led innovation is related with market pull strategy that identify and evaluate information related with customer and competitor to offer superior value and thus develop competitive advantage (28). Market pull strategy assists a company to predict underserved market needs and then conduct relevant activities accordingly (Calantone et al., 2002; and Jeong et al., 2006).
Many previous studies support the importance of market orientation in innovation strategy (Deshpande et al., 1993; Kitchell, 1995; and Sinkula, 1994). Narver and Slater (1990) argue that a market-oriented company tend to have greater innovation performance because it can fast response to dynamic and fast changing customer needs. Slater and Naver (1990) highlight that market-oriented companies are effective to develop customer needs and meet their needs by offering new innovative products. Deshapnde et al. (1993) also find evidences supporting positive relationship between market orientation and organisational performance.
Salavou et al. (2004) find that market-led innovation is effective for SMEs. In their framework, two factors affecting innovation performance: internal innovation strategy and external competition pressure. Internal innovation strategy covers on market orientation, which focuses on customers’ needs and wants and thus is consistent with market-led innovation. It also covers technology policy showing the importance of technology policy as auxiliary role in facilitating market-led innovation. External competition pressure covers firm concentration and entry barrier, which are two important variables in Porter’s Five Forces.
2.1.2 Technology-led innovation strategy
Technology-let innovation strategy needs sufficient R&D resources, new technology and better employee capabilities (Day, 2011). In resource-based review, these capabilities and resources are valuable, rare and non-imitable for competitors and therefore they sustain long-term competitive advantages of a company. Meanwhile, technology-led innovation therefore has long-term impacts on product innovation performance. Paladino (2009) finds empirical evidences supporting that technology-led strategy contributes to business confidence and help companies to exploit knowledge in external environment. Meanwhile, Saeed et al. (2015) also find such empirical evidences. Wilson et al. (1994) argue the important role of technology and regard it as a determinant of innovation. However, Day (2011) agree that not all companies have sufficient resources and capabilities to develop technology-led innovation.
The argument of Toditling and Kaufmann (2001) suggest that technology-led innovation strategy is not suitable for SMEs. They highlight that SMEs possess less resources including capital for R&D activities and confront with more uncertainties and barriers to innovation. Mbizi et al. (2013) agree that SMEs’ resources and capabilities hinder them to have great innovation performance.
2.1.3 Open Innovation
Open innovation can be an effective strategy for SMEs to overcome its own limited resources and capabilities because it allows a company to take advantage of external ideas and knowledge to implement its innovation. Van de Vrande et al. (2009) define open innovation as the combination of technology exploitation and technology exploration to maximise value from a company’s technological competencies. Gassmann et al. (2010) illustrate that open innovation is related with a company’s capability to control decentralised innovation and manage those external participants. Tidd (2014) highlights that companies obtain resources from external companies and adopt internal resources to form new products. Bengtsson et al. (2015) also mentioned that companies should reduce its boundaries with its environment to implement open innovation.
Chesbrough (2006) illustrates that no organisation can hold all resources for innovation while open innovation allows organisations to acquire external idea and knowledge to facilitate their own innovation. By open innovation, an organisation can draw knowledge from external sources including out-licensing, technology spin-offs and insourcing (figure 1). External knowledge sources include suppliers, university, customer, competitors, etc.
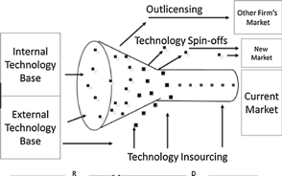
Figure 1: Open Innovation Approach
(Source: Chesbrough, 2006)
Open innovation can reduce R&D costs and then relieve R&D risk, offer an effective way to increase productivity, and help companies to address customer needs (Torkkeli et al., 2009). Open innovation allows a company to obtain innovation idea from its customers (Westa et al., 2014), which is consistent with market orientation and market-led innovation. Open innovation creates the platform that companies collaborate with customers, which helps these companies to improve their marketing activities (Westa et al., 2014). Lazzarotti et al. (2009) illustrate that open innovation positively affects profitability in long-term and thus promote shareholders’ satisfaction. Also, open innovation contributes to customer satisfaction and sales (Lazzarotti et al., 2009).
Stanislawski (2020) finds a large proportion of SMEs in European countries adopt open innovation. In Poland, 40.2% of medium companies adopt open innovation, 38.3% of small companies use it and 32.4% of micro companies employ it. 90% of SMEs claim that they adopt open very largely, largely or averagely in Stanislawski (2020)’s survey. The prevalence of open innovation in Poland’s SMEs implies the benefits of open innovation.
2.2 Innovation in SMEs
Beyene et al. (2016) show that firm size is a mediating factor affecting the relationship between innovation strategy and performance. They illustrate that SMEs tend to have weaker confidence, resources and capabilities to manage and control innovation process. Van Beisebroke (2005) find that large companies have greater productivity and performance than SMEs in terms of innovation. Cuaresma et al. (2012) illustrate that company size affects both innovation performance in project and commercial level. Based on above argument, it is safe to deduce that SMEs tend to have weak innovation outcome and commercialisation of their innovation outcome due to their size, resources and capabilities.
However, SMEs also have advantages in terms of innovation even though they are restricted by their resources (Dutta & Evrard, 1999). They have more flat organisational structure allowing them to be more sensitive to innovation opportunity and they tend to have a low level of bureaucratism to facilitate the implementation of innovation project (Salavou et al., 2004). Also, they tend to be more flexible to their innovation project. However, Mbizi et al. (2013) agree that SMEs’ flat organisational structure has positive impact on a company’s innovativeness. Those SMEs with fewer than 20 employees have the benefits of individualism in terms of innovation, while those SMEs with over 50 employees have more resources and capabilities for innovation (Mbizi et al., 2013). Zhang et al. (2013) also find that organisational structure can affect the goal and source of organisational learning and then organisational performance, which suggests that a flat structure may affect organisational performance.
2.3 Innovation Strategy and Organisational Performance
Innovation strategy has profound and significant impacts on organisational performance (Wang and Wang, 2012). Innovation strategy is related with innovation performance and the outcome of an innovation project is directly related with a company’s core competency. In resource-based review, core competency is associated with a company’s sustainable competitive advantage (Hope, 2001). However, a less effective innovation strategy tends to result in an innovation failure that even presses a company’s financial health and competitive advantage (Beyene et al., 2016). Thus, it is safe to deduce that innovation strategy has significant influence on organisational performance.
Mafini (2017) adopted the survey covering 272 mangers and employees of a South African State-Owned Enterprises and found a positive and significant relationship between innovation and organisational performance. Align with innovation, quality and inter-organisational system also have such relationship alone.
2.4 Critical Appraisal of Relevant Research
There are two contrasting viewpoints about the impact of market-led and technology-led innovation in SMEs. Salavou et al. (2004) study the impact of organisational innovation in Greek SMEs. This dissertation investigates determinants of organisational innovation in SMEs by analyse 150 questionnaires collected from manufacturing companies. This research proves the importance and positive impact of market-led innovation strategy. Market-led innovation strategy has positive and significant impacts on SME’s innovation activity. Salavou et al. (2004) find empirical evidences supporting the positive and significant impact of market-led innovation in Greek SMEs in food, drink and clothing industry. However, this research was conducted in 2004 when had no pressure of industry revolution. Furthermore, these industries are highly different with fresh food industry which tend to need technology innovation to solve high waste and prediction issues.
Hervas-Oliver et al. (2014) study the relationship between process innovation strategy and innovation performance in Spanish SMEs covering 2,412 companies from CIS database. This study finds that SMEs’ process innovation strategy largely depends on external sources of knowledge to cover their internal weak innovation capabilities, which is related with open innovation. They find that these SMEs’ innovation strategy is different with R&D-oriented product innovation strategies. This finding therefore suggests that technology-let innovation is less effective in Spanish SMEs.
On the other hand, many scholars show empirical evidences supporting that both technology-led and market-led innovation strategy positive affect product innovation performance (Al-Ansari et al., 2013; and Delgado et al., 2013). These findings are inconsistent with Hervas-Oliver et al. (2014) and Salavou et al. (2004) who studied on SMEs. However, Beyene et al. (2016) find that firm size and ownership are mediating factor affecting the relationship between innovation strategy and innovation performance. This can explain the conflicting findings and suggests the importance of considering firm size and ownership in this dissertation. Beyene et al. (2016) considered small and large company as well as private and public companies, whereas they did not cover family ownership. Due to the two contrasting arguments, it is significant to study the market-led and technology-led innovation in China.
Stanislawski (2020) studies open innovation in Poland’s SMEs and focuses on determinants of the open innovation utilisation by collecting data via survey. This research highlights the benefits of using open innovation for SMEs based on theories, whereas it does not offer empirical evidences. Its quantitative analysis emphases on the determinants of open innovation usage. However, this research does not cover the research gap about the impact of open innovation on innovation performance in SMEs.
2.5 Chinese Fresh Food Retailing Market
Zhang (2016) summarises the challenges in Chinese fresh food retailing market including large product loss, high distribution cost, low product standardisation and low customer experience. Delfmann et al. (2011) also agree that the challenges in fresh food online retailing in Germany include high transportation cost, high wastes, difficulty to predict demand, and highly flexible prices of seafood. Low customer experience makes customers cannot pick fresh foods in e-commerce resulting low trust, which is consistent with Delfmann et al. (2011)’s argument. Furthermore, Zhang (2016) points out that fresh products have no standardised form including size, shape, quality and taste. High distribution costs are caused by refrigerated transportation and fast transportation to make seafood stay alive, which are much more expensive than normal transportation. Furthermore, in terms of large product loss, there are certain death rates of seafood during transportation. More importantly, without accurate prediction of demands, fresh food online retailers face large product loss (Zhang, 2016), which aligns with high waste in Delfmann et al. (2011)’s argument.
There are potential development strategies for Chinese fresh food online retailers (Zhang, 2016). They are advised to develop pre-sale mode to balance supply and demand thus avoiding wastes. This is a demand-driven model that takes pre-sales orders from customers to avoid oversupply, reduce transportation costs and inventory costs (Zhang, 2016). However, this demand apparently cannot grasp impulse consumption. Second strategy is standardisation of production. Zhang (2016) suggests online retailers to work with agricultural research institutions to develop standardised production technology, which align with open innovation. Standardised production techniques can improve the consistency of product quality and product quality. Thirdly, diversified distribution mode means to use different distribution approaches to address different products such as fruits, seafoods, meat, and so on. Fourthly, crowdsourcing model can improve the distribution efficiency and reduce distribution costs. In this model, online retailers recruit part-time deliverers to reduce costs. Moreover, online retailers are expected to offer customised services such as customised package, which are related with market-led innovation. Additionally, developing online brand community to facilitate customer relationship and loyalty is advised. The brand communication can share information related with fresh products, such as cooking, recipe, etc.
2.6 Conceptual Framework
Based on previous researches, this dissertation devises the following conceptual framework (Figure 2). In this framework, the independent variables include market-led innovation, technology-led innovation and open innovation. The dependent variable is organisational performance.
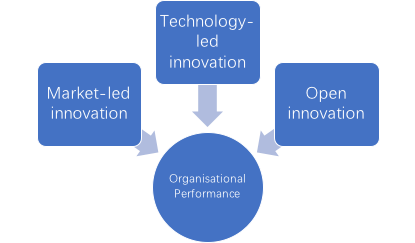
Figure 2: Conceptual Framework
According to the conceptual framework, this dissertation designs three groups of research hypotheses.
Hypothesis 1
· H0: there is no relationship between market-led innovation and organisational performance in Chinese SMEs with fresh food online retailing business.
· H1: there is a relationship between market-led innovation and organisational performance in Chinese SMEs with fresh food online retailing business.
Hypothesis 2
· H0: there is no relationship between technology-led innovation and organisational performance in Chinese SMEs with fresh food online retailing business.
· H1: there is a relationship between technology-led innovation and organisational performance in Chinese SMEs with fresh food online retailing business.
Hypothesis 3
· H0: there is no relationship between open innovation and organisational performance in Chinese SMEs with fresh food online retailing business.
· H1: there is a relationship between open innovation and organisational performance in Chinese SMEs with fresh food online retailing business.
Furthermore, this research determines to study the impact of firm size and ownership on the relationship between innovation strategy and organisational performance in those SMEs. Three scholars suggest that firm size is related with the relationship (Beyene et al., 2016; Cuaresma et al., 2012; and Van Beisebroke, 2005).
Therefore, this dissertation devises the following hypothesis:
Hypothesis 4
· H0: firm size is not a mediating factor affecting the relationship between innovation strategy and organisational performance in Chinese SMEs with fresh food online retailing business.
· H1: firm size is a mediating factor affecting the relationship between innovation strategy and organisational performance in Chinese SMEs with fresh food online retailing business.
Beyene et al. (2016) find that firm ownership is a mediating factor affecting the relationship between innovation strategy and innovation performance. Therefore, this dissertation sets the following hypothesis:
Hypothesis 5
· H0: firm ownership is not a mediating factor affecting the relationship between innovation strategy and organisational performance in Chinese SMEs with fresh food online retailing business.
· H1: firm ownership is a mediating factor affecting the relationship between innovation strategy and organisational performance in Chinese SMEs with fresh food online retailing business.
3.0 Research Methodology
3.1 Introduction
This dissertation designed its research methodologies in accordance with Saunders et al. (2012)’s framework shown in the below. Based on positivism, it used quantitative research and deductive approach and collected 179 questionnaires by convenience sampling technique. This used cross-sectional time horizon and thus only gathered primary data for once. Also, the data was analysed by regression, correlation and frequency analysis.
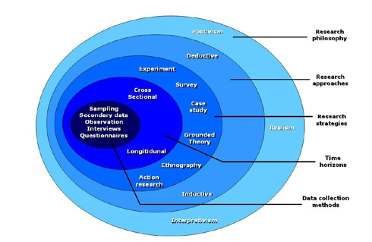
Figure 3: Research Methodologies
(Source: Saunders et al., 2012)
3.2 Quantitative Research
Quantitative research was applied to study the impact of innovation strategy on organisational performance in Chinese fresh retailing industry. Based on quantitative approach, this research can generate reliable and valid results thus contributing to the industry. Gill and Johnson (2002) agree that quantitative research is developed based on positivism that only scientific way to observe a phenomenon and generates reliable findings. The findings of positivism-based research are less arguable and controversial because they are supported by empirical evidences (Robson, 2002). Furthermore, Neuman (2005) illustrates a quantitative research uses a well-developed framework and a set of related methodologies to ensure high reliability and validity of its findings. This dissertation has developed a sound conceptual framework supported by previous researches in the Chapter Two. Also, it used a set of methodologies supporting quantitative approach including deductive approach, survey, questionnaires and convenience sampling. By these conducts, this research can prevent the impacts of its researcher on its results. Quantitative researches prevent the negative influences of biases and subjectivities on their results (Creswell, 2007). It uses statistical analysis to generate empirical results which therefore are less arguable. Moreover, the data used by a quantitative research can be used by further research.
Furthermore, many previous studies investing on the impact of innovation strategy used quantitative and survey (Saunders et al., 2009). These studies used quantitative research and survey perhaps because quantitative researches help researchers to collect a larger sample size in an effective way (Neuman, 2015).
However, qualitative research is not applicable for this dissertation. Although it has proficiency in discovering insights and in-depth findings, its results are arguable. Qualitative research relies on a researcher’s feelings and perception to generate results. In these researches, investigators directly involve into research phenomenon to percept it. However, perception and feelings can be highly varied among different investigators (Saunders et al., 2009). Thus, the results of qualitative researches are less convincing and tend to have low level of generalisation. This dissertation aims to make recommendations for whole Chinese fresh food industry, so it has to produce highly generalised results. Therefore, quantitative research was the most appropriate choice.
3.3 Deductive Approach
Deductive approach was applied by this dissertation. It correlates with positivism and helps positivism-researchers to build a conceptual framework for their researches (Saunders et al., 2009). This approach uses a top-down way that researchers build their research based on previous theories and knowledge and thus apply them to achieve research objectives (Collis and Hussey, 2003). These researchers collect previous theories from board to narrow. This dissertation critically evaluated previous knowledge in the Chapter and the knowledge supported its results from data analysis. The results of deductive approach are supported by previous theory, which therefore are more reliable and valid (Collis and Hussey, 2003). With correct data and analysis, this approach can ensure the validity and reliability of its results (Collis and Hussey, 2003). Therefore, this dissertation adopted deductive approach to make reliable recommendations.
On the other hand, inductive approach does not fit in this dissertation’s objectives and purpose. This approach uses observation to collect data and then design research question and objective. Nevertheless, this dissertation has clear objectives and questions and does not need to conduct observation. Also, inductive approach may require researchers to spend much time in designing research questions (Collis and Hussey, 2003). However, deductive approach allows researches to directly address research question, which is more efficient and effective. Inductive approach can generate insights but its findings are less supported by previous knowledge and thus more arguable (Collis and Hussey, 2003). However, this dissertation did not plan to find out any insights, but it found that existing theories were enough to address the impact of innovation strategy. Generally, deductive approach is more feasible and appropriate for this dissertation.
3.4 Survey
This dissertation applied survey to collect primary data. As a research strategy, survey aligns with quantitative research and can build a large sample size and gather huge amount of data in short-term (Colin, 2007). Survey can be more manageable for student-developed researches (Colin, 2007).
However, case study and focused group are less suitable for this dissertation. Case study concentrates on extremely small sample size to find out insights, whereas its results have low level of generalisation (Saunders et al., 2009). Clearly, it does not fit in this dissertation. Also, case study supports mixed research and uses a variety of data including quantitative and qualitative data to analyse one or a few of sample (Saunders et al., 2009). Nevertheless, this dissertation only planned to collect quantitative data. Focused group requires researchers to design all variables and to strictly control the whole process of data collection (Saunders et al., 2009). It is difficult for one researcher to practice this, whereas this dissertation only has one researcher.
3.5 Cross-sectional Time horizon
By using cross-sectional time horizon, this dissertation only collected primary data for once between 18th July and 20thAugust. It did not use any historical data because it focuses on the contemporary issue of innovation strategy in Chinese fresh industry.
3.6 Questionnaires
Using questionnaires to collect numerical data is prevalent and effective for quantitative research (Saunders et al., 2009). This dissertation collected 159 questionnaires from Chinese SMEs which conducted an innovation within the last 3 three year in fresh food online retailing industry. Questionnaire is effective and efficient because of two reasons (Saunders et al., 2009). Firstly, the internet can largely simplify and boost the convey of questionnaires. Secondly, the data collection process of questionnaires does not require any involvement of researches and their researches. Respondents can fulfil questionnaires by themselves mostly via the internet (Saunders et al., 2009). This therefore largely reduces research tasks of researchers so they can work on other tasks. Also, without the involvement of researchers, questionnaires prevent the negative their impacts on data validity. Furthermore, questionnaires can collect huge amount of data in a fast way and build a large sample size in short term (Saunders et al., 2009).
This dissertation developed an online questionnaire and built a website for it at www.wjx.cn. By the internet and social media mainly WeChat, this researcher spread the link of questionnaires to access SMEs in Chinese fresh food industry. Also, the research adopted leaflet to collect data.
The dissertation designed a close-end questionnaire to quantify respondents’ answers and five groups of questions. The first group of questions collected respondents’ demographics including age, gender and education. The second group measured respondents’ business including their business scale (annual revenue), year of operation, ownership, the number of employees and innovation personnel. The third group measured data for market-led innovation and the fourth group gather data for technology-led innovation. The last group collected data to measure respondents’ innovation performance. From the third group to the fifth group, all questions used Likert scale allowing respondents to choose from strongly disagree, disagree, neutral, agree and strongly agree.
3.7 Convenience Sampling Technique
Convenience sampling technique was used to access respondents. This technique allows researchers to gain data from those respondents who researchers can easily access (Saunders et al., 2009). Therefore, this helps researchers to build a large sample size in an effective way. By this technique, the dissertation collected 179 questionnaires by taking advantage of the researcher’s social connections. Nevertheless, probability sampling techniques were not applicable. To implement them, the researcher had to ensure that everyone in research population had the same probability to be selected. However, it was impossible to cover all SMEs in Chinese fresh market. Meanwhile, there was no relevant database for this study. Thus, convenience sampling technique was the best choice.
By convenience sampling technique, the researcher adopted private social connections who had friends in Jinan sea food market. Through these friends, the researcher accessed three online chat groups in WeChat (a Chinese mainstream social media). These groups were built for SMEs owners to communicate their fresh businesses. The researcher shared the link of the questionnaires to these groups to invite them. Also, the research printed some flyouts asking those friends to spread in the sea food market.
3.8 Data Analysis
Statistical analysis was used to analyse primary data, including regression, frequency and correlation analysis. Regression analysis evaluated the significance of the relationship between the dependent variable and the independent variables. Frequency analysis tested each question to understand SMEs owners’ attitude toward innovation. Correlation analysis assessed the strength of the relationship between the dependent variable and the independent variables.
3.9 Ethical Conduct
This research is sensitive ethical issues and fully fulfils the regulations and ethical standard of the University. It declaims zero involvement of deception and plagiarism. It was honest to all respondents and illustrated its purposes and aims in a consent letter. By the letter, potential respondents had fully understood what their rights were and what was the research about before they determined to offer data. They have the following rights: 1) quitting from this research; 2) withdrawing their data before 25th August; and 3) connecting the university to make confirmation. Furthermore, the research used anonymity strategy and did not asked or record any identity information of respondents. It is also confidential which means that only the university can access its data and results. This research did not plan any debriefing. Moreover, the researcher will destroy all primary data before 10th November.
4.0 Results
4.1 Introduction
This chapter starts with analysis demographics of respondents and their business operation. Then, it adopts frequency analysis to measure their usage of market-led, technology-led and open innovation and their innovation performance. Then, it uses correlation and regression analysis to examine the relationship between the independent variables and dependent variable and test hypotheses.
4.2 Demographics and Business Operation
All respondents are owners of SMEs and involved innovation in the last three years. There are more male respondents than female respondents. The largest age group is 37.7% (30 to 37), followed by 22 to 29.
|
Frequency |
Percentage (%) |
||
|
Do you own a SME involving fresh food business? |
159 |
100 |
|
|
Have your business involved any innovation within the last three years? |
159 |
100 |
|
|
Gender |
Male |
104 |
65.4 |
|
Female |
55 |
34.6 |
|
|
Age |
22 to 29 |
37 |
23.3 |
|
30 to 37 |
60 |
37.7 |
|
|
38 to 45 |
28 |
17.6 |
|
|
45 to 52 |
18 |
11.3 |
|
|
Over 52 |
16 |
10.1 |
Table 1
The business operation of these respondents is showed in the table 2. 35.2% of respondents have a shareholding-system company, followed by sole proprietorship and family ownership. The distribution of firm ownership is basically balanced.
44.0% of SMEs have fewer 10 employees, suggesting a small scale. Only 6 SMEs have 50 to 100 employees. However, 47.8% of SMEs can gain 1 to 2 million (CNY) and 36.5% of SMEs can obtain 2 to 4 million revenue annually.
47.8% of SMEs sell sea foods followed by fruit (28.9%) and meat (17.6%).
|
Frequency |
Percentage (%) |
||
|
Firm ownership |
Family business |
51 |
32.1 |
|
Sole proprietorship |
52 |
32.7 |
|
|
Shareholding system |
56 |
35.2 |
|
|
Number of employees |
Below 10 |
70 |
44.0 |
|
10 to 20 |
47 |
29.6 |
|
|
21 to 30 |
15 |
9.4 |
|
|
31 to 40 |
11 |
6.9 |
|
|
41 to 50 |
10 |
6.3 |
|
|
Over 50 but below 100 |
6 |
3.8 |
|
|
Revenue level (CNY) |
Below 500,000 |
5 |
3.1 |
|
500,001 to 1,000,000 |
20 |
12.6 |
|
|
1 million to 2 million |
76 |
47.8 |
|
|
2 to 4 million |
58 |
36.5 |
|
|
What kind of fresh food do you involve? |
Seafood |
76 |
47.8 |
|
Fruit |
46 |
28.9 |
|
|
Meat |
28 |
17.6 |
|
|
Others |
9 |
5.7 |
Table 2
4.3 Frequency Analysis
Before the frequency analysis, this questionnaire uses 1-to-5-point scale from strongly disagree to strongly agree. In other words, strongly disagree equates to 1.0 while strongly agree equates to 5.0.
Based on the mean in table 3, it is safe to say that more respondents are inclined to market-let innovation. 70.0% of respondents agree that they focused on customer demands to develop innovation strategy (mean = 3.7421). This shows that most of respondents pay attention to customer demands.
46.5% of respondents agree that consider how to improve customer satisfaction in the process of developing innovation strategy (mean = 3.2767). It means that less half of respondents consider customer satisfaction in the process of developing innovation strategy.
49.7% of respondents agree that they expect to improve customer value when I developed innovation strategy. Only 9.4% of respondents strongly disagree with it and 14.5% of respondents disagree with it. With a mean (3.3962), it is safe to say that about half respondents expect to improve customer value.
Generally, about half of respondents show a tendency to market-led innovation strategy.
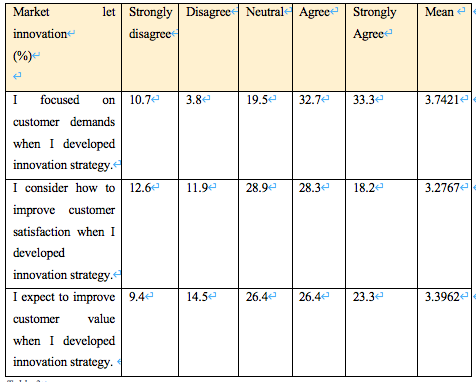
Table 3
The results shown in Table 4 suggest that fewer respondent adopted technology-led innovation. 61.7% of respondents disagree that they mainly focused new technologies in the process of developing innovation strategy (mean=2.4701). Furthermore, only 27.1% of respondent agree that they are technology focused.
61.4% of respondents disagree that their innovation strategy was designed based on what technologies they had and could afford (mean = 2.4088). Only 23.3% of respondents agree with it and 16.4% chose neutral. These results show that fewer respondent develop innovation strategy based on their technology resources.
60.4% of respondents disagree that they relied on technologies to implement their innovation (mean = 2.3774). Only 23.2% of respondents relied technologies to implement their innovation.
To sum up, these results in the table 4 indicate that most of respondents do not tend to use technology-let innovation strategy.
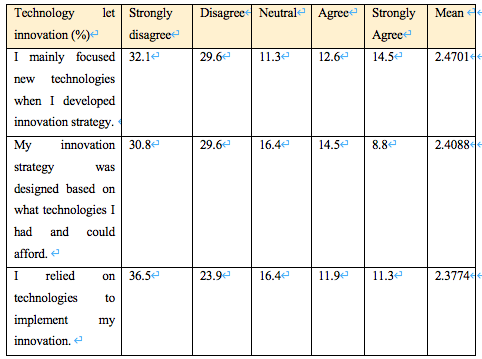
Table 4
The results in the table 5 show that these respondents have moderate use of open innovation as an innovation strategy. More respondents did not work with external for their innovation (mean = 2.8111), given that 24.5% of respondents strongly disagree with it and 16.4% disagree it.
However, 61.3% of respondents agree that they purchased technologies from external parties to implement my innovation. Only 14.5% of respondents strongly disagree with and 8.8% disagree with it.
Additionally, 41.5% of respondents used innovation ideas from customers, suppliers and competitors including 26.4% agree and 15.1% strongly agree (mean = 3.0503).
The usage of open innovation is moderate in these SMEs.
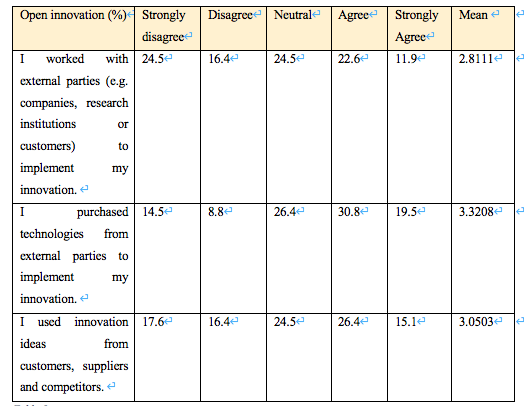
Table 5
59.2% of respondents increase their sales by innovation (mean = 3.4465), and 25.2% strongly agree with it, which suggest that the increase in sales is large. However, only 24.6% of respondents improved their profitability (2.9748) even though 59.2% of respondents increase their sales. This means that the costs of innovation were high that only increased revenue while did not rose profitability.
44.0% of respondents enhanced their competitive advantage by innovation (mean = 3.1761). 17.0% of respondents strongly agree with it, which implies that the improved competitive advantage is large. However, 28.9% of respondents chose neutral.
Generally, the improvement in sales and competitive advantages by their innovation is moderate and their innovation causes a low increase in profitability or no increase.
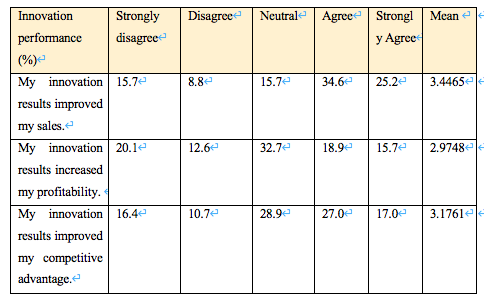
Table 6
4.4 Correlation Analysis
The co-coefficient is 0.476 (larger than 0.399) showing a weak relationship between technology-led innovation and organisational performance. Also, the P-value is 0.0001 showing a significant correlation.
|
Correlations |
|||
|
Organisational Performance |
Technology-led innovation |
||
|
Organisational Performance |
Pearson Correlation |
1 |
0.476** |
|
Sig. (2-tailed) |
0.000 |
||
|
N |
159 |
159 |
|
|
Technology-led innovation |
Pearson Correlation |
0.476** |
1 |
|
Sig. (2-tailed) |
0.000 |
||
|
N |
159 |
159 |
|
|
**. Correlation is significant at the 0.01 level (2-tailed). |
|||
Table 7
As Table 8 shows, the co-coefficient is 0.436 (larger than 0.399). Thus, relationship between market-led innovation and organisational performance is weak. Also, the P-value of the correlation is 0.0001, which means that there is a significant correlation.
|
Correlations |
|||
|
Organisational Performance |
Market-led innovation |
||
|
Organisational Performance |
Pearson Correlation |
1 |
0.436** |
|
Sig. (2-tailed) |
0.000 |
||
|
N |
159 |
159 |
|
|
Market-led innovation |
Pearson Correlation |
0.436** |
1 |
|
Sig. (2-tailed) |
0.000 |
||
|
N |
159 |
159 |
|
|
**. Correlation is significant at the 0.01 level (2-tailed). |
|||
Table 8
The co-coefficient in table 9 is 0.687 (larger than 0.399 and smaller than 0.699) demonstrating that there is a moderate relationship between organisational performance and open innovation.
Therefore, open innovation is the strongest factor, followed by technology-led innovation, whereas market-let innovation is the weakness.
|
Correlations |
|||
|
Organisational Performance |
Open Innovation |
||
|
Organisational Performance |
Pearson Correlation |
1 |
0.687** |
|
Sig. (2-tailed) |
0.000 |
||
|
N |
159 |
159 |
|
|
Open Innovation |
Pearson Correlation |
0.687** |
1 |
|
Sig. (2-tailed) |
0.000 |
||
|
N |
159 |
159 |
|
|
**. Correlation is significant at the 0.01 level (2-tailed). |
|||
Table 9
4.5 Regression Analysis
4.5.1 Market-let, Technology-let and open innovation
To measure the relationship between the dependent variables and the independent variable, this research uses the Equation A:
Innovation performance = β + β open innovation + β technology-led innovation + β market-led innovation.
The R is 0.726 in table 10, showing a relatively strong relationship between market-let innovation, technology-let innovation, open innovation and innovation performance. The R Square is 0.528 shows that 52.8% of variants in innovation performance can be explained by market-let innovation, technology-let innovation and open innovation. The 47.2% of variants in innovation performance cannot be predicted by the three factors.
|
Model Summary |
||||
|
R |
R Square |
Adjusted R Square |
Std. Error of the Estimate |
|
|
0.726a |
0.528 |
0.518 |
0.79031 |
|
|
a. Predictors: (Constant), Market-let innovation, Technology-let innovation, open innovation |
||||
Table 10
The P-value in Table 11 is 0.001, showing that the relationship between the independent variables and dependent variable is significant.
|
ANOVAa |
||||||
|
|
Sum of Squares |
df |
Mean Square |
F |
Sig. |
|
|
|
Regression |
108.104 |
3 |
36.035 |
57.693 |
0.000b |
|
Residual |
96.812 |
155 |
0.625 |
|||
|
Total |
204.915 |
158 |
||||
Table 11
As Table 12 shows, P-value of market-led innovation is 0.189 (> 0.05), so the relationship between market-led innovation and innovation performance is insignificant. Also, P-value of open innovation (0.0001) and technology-led innovation (0.0001) is smaller than 0.005. Hence, they have a significant relationship with innovation performance respectively.
|
Coefficientsa |
||||||
|
|
Unstandardized Coefficients |
Standardized Coefficients |
t |
Sig. |
||
|
B |
Std. Error |
Beta |
||||
|
|
(Constant) |
0.608 |
0.246 |
2.469 |
0.015 |
|
|
Open Innovation |
0.550 |
0.062 |
0.564 |
8.850 |
0.000 |
|
|
Technology-led innovation |
0.229 |
0.068 |
0.215 |
3.390 |
0.001 |
|
|
Market-led innovation |
0.101 |
0.077 |
0.086 |
1.320 |
0.189 |
|
|
a. Dependent Variable: ALLOP |
||||||
Table 12
Equation A: Innovation performance = 0.608 + 0.55 open innovation + 0.229 technology-led innovation + 0.101 market-led innovation
4.5.2 Firm size
To examine the impact of firm size as a mediating factor, this research used the number of employee and revenue level as index of firm size. Then, it runs the following Equation B:
Organisational Performance = β + β open innovation + β technology-led innovation + β market-led innovation + firm size.
R value is 0.726 and R Square is 5.28 in Equation B (the table 13), which is same with those in the Equation A. This means that firm size did not change the strength of the relationship between those independent variables and the dependent variable.
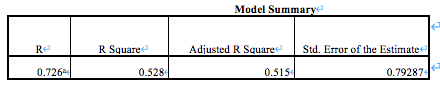
Table 13
Also, the P-value of firm size is 0.983 showing that there is no significant relationship between firm size and organisational performance.
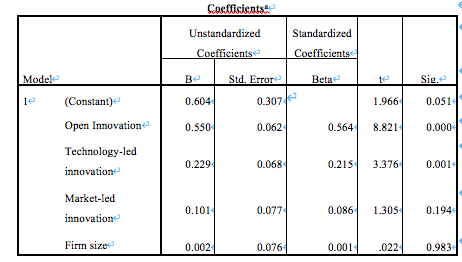
Table 14
Also, this research runs a correlation between organisational performance and firm size. The correlation co-efficient is 0.023, showing there is no such relationship. The P-value is 0.773, so there is no significant relationship.
|
Correlations |
|||
|
Organisational Performance |
Firm size |
||
|
Organisational Performance |
Pearson Correlation |
1 |
0.023 |
|
Sig. (2-tailed) |
0.773 |
||
|
N |
159 |
159 |
|
|
Firm size |
Pearson Correlation |
0.023 |
1 |
|
Sig. (2-tailed) |
0.773 |
||
|
N |
159 |
159 |
|
Table 15
Based on the results of the correlation and regression, it is safe to say that firm size is not a mediating factor in SMEs.
4.5.3 Ownership
Family Ownership
32.1% of SMEs have a family ownership.
|
Relationship with organisational performance |
Correlation |
Regression R=0.650 R Square=0.422 Moderate relationship |
|
Market-let innovation |
0.197 No relationship |
0.886 Insignificant |
|
Technology-let innovation |
0.420 Weak |
0.046 Significant |
|
Open innovation |
0.608 Moderate |
0.000 Significant |
Table 16
Sole proprietorship
32.7% of SMEs have a family ownership.
|
Relationship with organisational performance |
Correlation |
Regression R=0.756 R Square=0.571 Strong relationship |
|
Market-let innovation |
0.569 Moderate |
0.142 Insignificant |
|
Technology-let innovation |
0.612 Moderate |
0.009 Significant |
|
Open innovation |
0.652 Moderate |
0.001 Significant |
Table 17
Shareholding system
35.2% of SMEs have a family ownership.
|
Relationship with organisational performance |
Correlation |
Regression R=0.798 R Square=0.639 Strong relationship |
|
Market-let innovation |
0.497 Weak |
0.565 Insignificant |
|
Technology-let innovation |
0.553 Moderate |
0.095 Insignificant |
|
Open innovation |
0.779 Strong |
0.0001 Significant |
Table 18
4.5.4 Comparison of Firm Ownership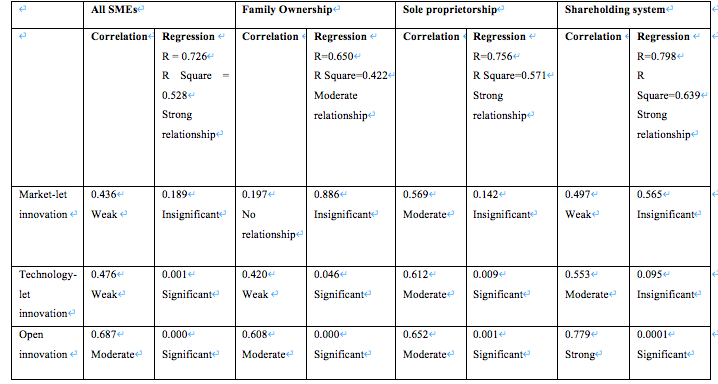
Table 19
As Table 19 shows, market-let innovation has no relationship with innovation performance in family ownership. Its relationship with innovation performance is the strongest in a joint-stock system, followed by sole proprietorship. In all types of firm ownership, its impact is insignificant.
Technology-let innovation has the strong impacts in sole proprietorship and the weakest impacts in family ownership. Its impacts in shareholding system is medium and insignificant.
Additionally, open innovation has the strongest and significant impacts on organisational performance in shareholding system. It has the weakest impacts in family ownership, while its impacts in sole proprietorship is middle.
These results show that firm ownership is a mediating factor affecting the relationship between innovation strategy and organisational performance.
4.6 Summary of Results
Above analysis examines the following hypothesis.
|
Hypothesis |
Status |
|
1. H1: there is a relationship between market-led innovation and organisational performance in Chinese SMEs with fresh food retailing business. |
Accepted |
|
2. H1: there is a relationship between technology-led innovation and organisational performance in Chinese SMEs with fresh food retailing business |
Accepted |
|
3. H1: there is a relationship between open innovation and organisational performance in Chinese SMEs with fresh food retailing business. |
Accepted |
|
4. H0: firm size is not a mediating factor affecting the relationship between innovation strategy and organisational performance in Chinese SMEs with fresh food retailing business. |
Accepted |
|
5. H1: firm ownership is a mediating factor affecting the relationship between innovation strategy and organisational performance in Chinese SMEs with fresh food retailing business. |
Accepted |
Furthermore, the research finds that these respondents have more involvement in market-led innovation and less involvement in technology-led innovation. However, the impact of technology-led innovation is stronger. Additionally, open innovation has the strongest impacts. Firm size has no impact, but firm ownership is a mediating factor.
5.0 Discussion
What innovation strategy Chinese SMEs in fresh food retailing industry should use to improve their organisational performance to grasp the rising demands?
This research argues that open innovation is the best strategy for Chinese SMEs. It finds that market-led innovation strategy has a weaker impact than technology-led innovation strategy while more Chinese SMEs adopt the former.Firstly, it finds that market-led innovation strategy has a weaker impact than technology-led innovation, which conflicts with Salavou et al. (2004) and Hervas-Oliver et al. (2014). However, the two studies did not aim at Chinese fresh food online retailing industry. The industry is unique because of its high large product loss, high distribution cost, and low product standardisation. Thus, market-led innovation is weaker to solve these challenges in the industry. This research finds that technology-led innovation strategy has stronger impacts on innovation performance, which can be explained by the argument that these challenges in the industry must be solved by technologies. These SMEs may be fully aware of customers’ desires but lack resources to conduct technology-led innovation. This argument is consistent with Toditling and Kaufmann (2001) who highlight that SMEs possess less resources including capital for R&D activities and confront with more uncertainties and barriers to innovation. Meanwhile, Mbizi et al. (2013) agree that SMEs’ resources and capabilities are limited. Generally, market-led innovation is less effective because the problems in the industry must be solved by technology.
Furthermore, this research finds that more SMEs adopted market-led innovation whereas most of these SMEs’ organisational performance are improved moderately and their profitability is not improved by market-led innovation. This suggests that market-led innovation cannot solve those challenges in Chinese fresh food online retailing industry (Zhang, 2016).
This research finds that open innovation has the stronger impacts. This finding can be explained by the fact that open innovation covers both market orientation and technology innovation. In Chesbrough (2006), an organisation can draw knowledge from external sources: suppliers, university, customer, competitors, etc. by open innovation. Thus, Chinese SMEs can obtain opinions and ideas from customers, suppliers and competitors, which aligns with market-led innovation. More importantly, Tidd (2014) illustrate that companies obtain resources from external companies and adopt internal resources to form new products, which supports technology-led innovation. A Chinese SME can gain external knowledge and capabilities and use a collaboration with external partners to develop its own innovation project by open innovation, in accordance with Chesbrough (2006) and Westa et al. (2014). Generally, it is safe to say that open innovation is suitable and helpful for SMEs to address their limited resources and meet customers’ demands.
Therefore, this research suggests that Chinese SMEs in the industry adopt open innovation. Firstly, open innovation has a better performance than others (market-led and technology-led innovation) regardless of firm ownerships. Secondly, previous studies highlight that open innovation can reduce R&D costs and then relieve R&D risk, offer an effective way to increase productivity, and help companies to address customer needs (Torkkeli et al., 2009). Given that Chinese SMEs have a small size and insufficient resources, open innovation can help them to reduce risks. Beyene et al. (2016) point out the negative impacts of less effective innovation strategy on organisational performance and competitive advantages. Controlling risks and costs is especially important for SMEs. Thus, open innovation can help SMEs to reduce risks and costs.
This research finds that open innovation has a moderate relationship with organisation performance, which is supported by previous studies. Open innovation positively affects profitability in long-term, shareholders’ satisfaction, customer satisfaction and sales performance (Lazzarotti et al., 2009). Furthermore, Stanislawski (2020) finds a large proportion of SMEs in European countries and Poland adopt open innovation. Moreover, Gassmann et al. (2010) highlight that open innovation is related with a firm’s ability to control decentralised innovation and manage those external participants. Therefore, Chinese SMEs should develop such capabilities. In accordance with Chesbrough (2006)’s theory, they should draw knowledge by out-licensing, technology spin-offs and insourcing and from research centres, suppliers, university, customer, competitors, etc.
Furthermore, this research finds that firm size has no impacts on the relationship between innovation strategy and organisational performance. This finding is inconsistent with Mbizi et al. (2013)’s argument that those SMEs with fewer than 20 employees have the benefits of individualism in terms of innovation while those with over 50 employees have more resources and capabilities for innovation. However, this research does not find strong evidence suggesting the benefits of individualism or those of more resources and capabilities.
Moreover, this research finds that firm ownership is a mediating factor affecting the relationship between innovation strategy and organisational performance. This aligns with the following argument: flat organisational structure is related with innovation (Dutta & Evrard, 1999); bureaucratism hinders implementation of innovation project and organisational flexibility is related with the implementation of innovation project (Salavou et al., 2004).
6.0 Conclusions
6.1 Summary
This research argues that open innovation is the best strategy for Chinese SMEs. It finds that market-led innovation strategy has a weaker impact than technology-led innovation strategy while more Chinese SMEs adopt the former. Chinese SMEs have more involvement in market-led innovation and less involvement in technology-led innovation. However, the impact of technology-led innovation is stronger. Additionally, open innovation has the strongest impacts. Firm size has no impact, but firm ownership is a mediating factor. Market-led innovation cannot solve those challenges (high product loss, high costs, inaccuracy to predict demand, and low customer experience) in Chinese fresh food online retailing industry. Technology-led innovation is necessary to solve these challenges. However, these SMEs are constricted by their capabilities. Market-led innovation cannot solve those challenges in Chinese fresh food online retailing industry. Chinese SMEs can obtain opinions and ideas from customers, suppliers and competitors, which aligns with market-led innovation. They can obtain external knowledge and capabilities and use a collaboration with external partners to develop its own innovation project by open innovation. Open innovation has a stronger impact on innovation performance in all firm ownership (family, sole and shareholding). Given that Chinese SMEs have a small size and insufficient resources, it is important for them to adopt open innovation to reduce risks and control costs. By proper open innovation, these SMEs can develop their profitability in long-term, shareholders’ satisfaction, customer satisfaction and sales performance.
6.2 Recommendations for Further Research
Firm ownership is a mediating factor, so further research can explain the impact of ownership on the relationship between innovation strategy and organisational performance in details. Also, this research finds that 47.2% of variants in innovation performance cannot be predicted by market-led, technology-led and open innovation. Further research can adopt interview with qualitative approach to explore out these factors affecting innovation performance. This research finds the positive impacts of open innovation. Further research can find out the specific activities under open innovation can be used by Chinese SMEs in online fresh food retailing industry.
Reference
Al-Ansari, Y., Altalib, M., & Sardoh, M. (2013). Technology Orientation, Innovation and Business Performance: A Study of Dubai SMEs. The International Technology Management Review, 3(1), pp. 1-11.
Bengtsson, L.; Lakemond, N.; Lazzarotti, V.; Manzini, R.; Pellegrini, L.; Tell, F. (2015). Open to a Select Few? Matching Partners and Knowledge Content for Open Innovation Performance. Creation Innovation Management, 24, 72–86.
Beyene, K. T., Shi, C. S. and Wu, W. W. (2016) The Impact of Innovations Strategy on Organisational Learning and Innovation Performance: Do Firm Size and Ownership Type Make a Difference?, South African Journal of Industrial Engineering, 27(1), pp 125-136
Brem, A. and Voigt, K. (2009). Integration of market pull and technology push in the corporate front end and innovation management—Insights from the German software industry, Technovation 29, 351-367.
Carr, C. (1999) Globalisation, strategic alliances, acquisitions and technology transfer: Lessons from ICL/Fujitsu and Rover/Honda and BMW. R&D Management, 29 (4): 405–421.
Calantone, R. J., Cavusgil, S. T., & Zhao, Y. (2002). Learning orientation, firm innovation capability, and firm performance. Industrial Marketing Management, 31(6), pp. 515-524.
Chesbrough, H.W. (2003) Open innovation: the new imperative for creating and profiting from technology. Harvard Business School Press, Boston MA.
Chesbrough, H. (2006). Open Business Models: How to Thrive in the New Innovation Landscape; Harvard Business School Press: Boston, MA, USA; pp. 21–49.
Chesbrough, H.W., Crowther, A.K. (2006) Beyond high-tech: early adopters of open innovation in other industries. R&D Management 36, 229-236.
Cuaresma, J. C., Oberhofer, H., & Vincelette, G. A. (2012). Firm growth and productivity in Belarus: new empirical evidence from the machine building industry. World Bank Policy Research Working Paper (6005).
Creswell, J. W. (2007). Qualitative inquiry and research design: Choosing among five approaches (2nd ed.). USA: Sage Publication.
Colin, N. (2007) ‘Introduction to Research and Research Methods’, Bradford: Bradford University
Collis, J. and Hussey, R. (2003) ‘Business Research: a practical guide for undergraduate and postgraduate students’, second edition. Basingstoke: Palgrave Macmillan.
Day, G. S. (2011). Closing the marketing capabilities gap. Journal of Marketing, 75(4), pp.183-195.
Defmann, W., Albers, S. and Skmevskiy, V. (2011). Concepts, challenges and market potential for online food retailing in Germany, Department of Business Policy and
Logistics, University of Cologne, Working Paper: No 108.
Deshpande´, R., Farley, J.U. and Webster, F.E. Jr (1993), “Corporate culture, customer orientation, and innovativeness in Japanese firms: a quadrad analysi”, Journal of Marketing, Vol. 57 No. 1, pp. 23-57.
Dutta, S. and Evrard, P. (1999), “Information technology and organization within European small enterprises”, European Management Journal, Vol. 17 No. 3, pp. 239-51.
Ende, J., and Dolfsma, W., (2005). Technology-push, demand-pull and the shaping of technological paradigms-Patterns in the development of computing technology. Journal of Evolutionary Economics 15 (1), 83–99.
Gassmann, O.; Enkel, E.; and Chesbrough, H. (2010). The future of open innovation. R D Management, 40, 213–221.
Gies, E. (2018) The Consequences of China’s Booming Demand for Seafood, Retrieved from: https://www.hakaimagazine.com/news/the-consequences-of-chinas-booming-demand-for-seafood
Gill, J. and Johnson, P. (2002) Research Methods for Managers (3rd edn). London: Sage
Hervas-Oliver, J., Ripoll, S.F. and Boronat-Moll, C. (2014). Process innovation strategy in SMEs, organizational innovation and performance: a misleading debate, Small Business Economy, 43, 873-866.
Hope, H., V., (2001). Breaking the mould? Innovation as a strategy for corporate renewal. International Journal of Human Resource Management 12 (7), 1126–1140
Huizingh, E. (2010) Open innovation: state of the art and future perspectives. Tech innovation 31, 2-9.
Jaworski, B.J. and Kohli, A.K. (1993), “Market orientation: antecedents and consequences”, Journal of Marketing, Vol. 57 No. 3, pp. 53-70.
Jeong, I., Pae, J. H., & Zhou, D. (2006). Antecedents and consequences of the strategic orientations in new product development: The case of Chinese manufacturers. Industrial Marketing Management, 35(3), pp. 348-358.
Kitchell, S. (1995), “Corporate culture, environmental adaptation, and innovation adoption”, Journal of the Academy of Marketing Science, Vol. 23 No. 3, pp. 195-205.
Lazzarotti, V. and Manzini, R. (2009) Different modes of open innovation: A theoretical framework and an empirical study. International Journal Innovation Management., 13, 615–636.
Mafini, C. (2017). Predicting Organisational Performance by Innovation Quality and Inter-organisational Systems: A Public Sector Perspectives, the Journal of Applied Business Research, 31(3), 939-954.
Martín-de Castro, G., Delgado-Verde, M., Navas-López, J. E., & Cruz-González, J. (2013). The moderating role of innovation culture in the relationship between knowledge assets and product innovation. Technological Forecasting and Social Change, 80(2), pp. 351-363.
Mbizi, R., Hove, L. and Thondhlana, A. (2013) Innovation in SMEs: A review of its role to organisational performance and SMEs operations sustainability, Interdisciplinary Journal of Contemporary Research in Business, 4(11), 370 – 390.
Narver, J.C. and Slater, S.F. (1990), “The effect of a market orientation on business profitability”, Journal of Marketing, Vol. 54 No. 4, pp. 20-35.
Neuman, W.L. (2005) Social Research Methods (6th edn). London: Pearson.
Paladino, A. (2009). Financial Champions and Masters of Innovation: Analyzing the Effects of Balancing Strategic Orientations. Journal of Product Innovation Management, 26(6), pp. 616-626
Robson, C. (2002) Real World Research: A Resource for Social Scientists and Practitioner-Researchers, (2nd edn). Oxford: Blackwell
Saiidi, U. (2018). Inside Alibaba’s new kind of superstore: Robots, apps and overhead conveyor belts, Retrieved from: https://www.cnbc.com/2018/08/30/inside-hema-alibabas-new-kind-of-superstore-robots-apps-and-more.html#:~:text=Alibaba%20is%20rapidly%20expanding%20its,operates%20on%20cutting%2Dedge%20innovations.
Saeed, S., Yousafzai, S., Paladino, A., & De Luca, L. M. (2015). Inside-out and outside-in orientations: A meta-analysis of orientation's effects on innovation and firm performance. Industrial Marketing Management, 47, pp.121-133.
Salavou, H., Baltas, G. and Lioukas, S. (2004). Organisational Innovation in SMEs: The Importance of Strategic Orientation and Competitive Structure, European Journal of Marketing, 38(9/10):1091-1112
Saunders, M., Lewis, P., and Thornhill A. (2009) Research Methods for Business Students, 6th edn. Harlow: Prentice Hall.
Sinkula, J.M. (1994), “Market information processing and organizational learning”, Journal of Marketing, Vol. 58 No. 1, pp. 35-45.
Slater, S.F. and Narver, J.C. (1994), “Does competitive environment moderate the market orientation-performance relationship?”, Journal of Marketing, Vol. 58 No. 1, pp. 46-55.
Tidd, J. (2014). Open Innovation Research, Management; Imperial College Press: London, UK.
Torkkeli, M.T.; Kock, C.J.; Salmi, P.A.S. (2009). The Open Innovation paradigm: A contingency perspective. Journal IndianEngine Management, 2, 176–207.
Tsai, Y. and Wensley, R. (2000), “Market orientation and the organizational culture of Taiwanese business”, paper presented at the 29th EMAC Conference, Rotterdam.
Van Biesebroeck, J. (2005). Firm size matters: Growth and productivity growth in African manufacturing. Economic Development and Cultural Change, 53(3), pp. 545-583.
Van de Vrande, V.; de Jong, J.P.; Vanhaverbeke,W.; De Rochemont, M. (2009). Open innovation in SMEs: Trends, motives and management challenges. Technovation, 29, 423–437.
Wang, Z., and Wang, N. (2012). Knowledge sharing, innovation and firm performance. Expert Systems with Applications, 39(10), pp. 8899-8908
Wilson, A.L., Ramamurthy, K. and Nystrom, P.C. (1999), “A multi-attribute measure for innovation adoption: the context of imaging technology”, IEEE Transactions on Engineering Management, Vol. 46 No. 3, pp. 311-21.
Zhang, J. (2016). Situation Analysis and Strategic Development of Fresh food E-commerce in China, International Conference on Computer and Information Technology Application, 176 – 182.
Zou, S.M.; Zeng, D.M.; Zhang, L.F.; Chen, W.J. (2017) Network relationship, technology diversification and technology standardization ability of enterprises. Science Resource Management., 38, 12–20.
Questionnaires
Hi
I am undergraduate student of Loughborough University. I am collecting primary data for my dissertation.
If you own a SME involved in fresh food retailing business, you are invited.
The aim of this research is to examine causal relationship between innovation strategy and organisational performance in SMEs of Chinese fresh food retailing industry. It focuses on three innovation strategies including market-led innovation, technology-led innovation and open innovation. The purpose of the research is to identify an effective innovation strategy for these SMEs to solve their challenges including high waste, high transportation costs, etc.
You have the following rights: 1) quitting from this research; 2) withdrawing their data before 25th August; and 3) connecting the university to make confirmation. My university’s website: https://www.lboro.ac.uk/?external
This is a confidential and anonymous research. It does not asked or record any identity information about you.
Do you own a fresh food retailing business?
Yes
No
Have your business involved any innovation within the three years?
Yes
No
What is your gender?
Male
Female
How old are you?
20 to 30
31 to 40
41 to 50
Over 50
What is your company’s ownership?
Family business
Sole proprietorship
Joint-stock system
How many employees do you have?
Below 10
10 to 20
21 to 30
31 to 40
41 to 50
Over 50 but below 100
How much annual revenue does your business can generate (CNY)?
Below 500,000
500,001 to 1,000,000
1 million to 2 million
2 to 4 million
What kind of fresh food does your company involve?
Seafood
Fruit
Meat
Others
Please read the following statement and tell me your opinion by selecting one of five options from strongly disagree to strongly agree.
Market let innovation
I focused on customer demands when I developed innovation strategy.
|
Strongly disagree |
Disagree |
Neutral |
Agree |
Strongly agree |
I consider how to improve customer satisfaction when I developed innovation strategy.
|
Strongly disagree |
Disagree |
Neutral |
Agree |
Strongly agree |
I wise to improve customer value when I developed innovation strategy.
|
Strongly disagree |
Disagree |
Neutral |
Agree |
Strongly agree |
Technology let innovation
I mainly focused new technologies when I developed innovation strategy.
|
Strongly disagree |
Disagree |
Neutral |
Agree |
Strongly agree |
My innovation strategy was designed based on what technologies I had and could afford.
|
Strongly disagree |
Disagree |
Neutral |
Agree |
Strongly agree |
I relied on technologies to implement my innovation.
|
Strongly disagree |
Disagree |
Neutral |
Agree |
Strongly agree |
Open innovation
I worked with external parties (e.g. companies, research institutions or customers) to implement my innovation.
|
Strongly disagree |
Disagree |
Neutral |
Agree |
Strongly agree |
I purchased technologies from external parties to implement my innovation.
|
Strongly disagree |
Disagree |
Neutral |
Agree |
Strongly agree |
I used innovation ideas from customers, suppliers and competitors.
|
Strongly disagree |
Disagree |
Neutral |
Agree |
Strongly agree |
Organisational Performance
My innovation results improved my sales.
|
Strongly disagree |
Disagree |
Neutral |
Agree |
Strongly agree |
My innovation results increased my profitability.
|
Strongly disagree |
Disagree |
Neutral |
Agree |
Strongly agree |
My innovation results improved my competitive advantage.
|
Strongly disagree |
Disagree |
Neutral |
Agree |
Strongly agree |
Appendix
Results of 159 questionnaires
|
Do you own |
|||||
|
Frequency |
Percent |
Valid Percent |
Cumulative Percent |
||
|
Valid |
1.00 |
149 |
93.7 |
93.7 |
93.7 |
|
2.00 |
10 |
6.3 |
6.3 |
100.0 |
|
|
Total |
159 |
100.0 |
100.0 |
||
|
Have you |
|||||
|
Frequency |
Percent |
Valid Percent |
Cumulative Percent |
||
|
Valid |
1 |
149 |
93.7 |
93.7 |
93.7 |
|
2 |
10 |
6.3 |
6.3 |
100.0 |
|
|
Total |
159 |
100.0 |
100.0 |
||
|
Gender |
|||||
|
Frequency |
Percent |
Valid Percent |
Cumulative Percent |
||
|
Valid |
1.00 |
104 |
65.4 |
65.4 |
65.4 |
|
2.00 |
55 |
34.6 |
34.6 |
100.0 |
|
|
Total |
159 |
100.0 |
100.0 |
||
|
Age |
|||||
|
Frequency |
Percent |
Valid Percent |
Cumulative Percent |
||
|
Valid |
1.00 |
37 |
23.3 |
23.3 |
23.3 |
|
2.00 |
60 |
37.7 |
37.7 |
61.0 |
|
|
3.00 |
28 |
17.6 |
17.6 |
78.6 |
|
|
4.00 |
18 |
11.3 |
11.3 |
89.9 |
|
|
5.00 |
16 |
10.1 |
10.1 |
100.0 |
|
|
Total |
159 |
100.0 |
100.0 |
||
|
ownership |
|||||
|
Frequency |
Percent |
Valid Percent |
Cumulative Percent |
||
|
Valid |
1 |
51 |
32.1 |
32.1 |
32.1 |
|
2 |
52 |
32.7 |
32.7 |
64.8 |
|
|
3 |
56 |
35.2 |
35.2 |
100.0 |
|
|
Total |
159 |
100.0 |
100.0 |
||
|
Employee number |
|||||
|
Frequency |
Percent |
Valid Percent |
Cumulative Percent |
||
|
Valid |
1.00 |
70 |
44.0 |
44.0 |
44.0 |
|
2.00 |
47 |
29.6 |
29.6 |
73.6 |
|
|
3.00 |
15 |
9.4 |
9.4 |
83.0 |
|
|
4.00 |
11 |
6.9 |
6.9 |
89.9 |
|
|
5.00 |
10 |
6.3 |
6.3 |
96.2 |
|
|
6.00 |
6 |
3.8 |
3.8 |
100.0 |
|
|
Total |
159 |
100.0 |
100.0 |
||
|
Revenue level |
|||||
|
Frequency |
Percent |
Valid Percent |
Cumulative Percent |
||
|
Valid |
1.00 |
5 |
3.1 |
3.1 |
3.1 |
|
2.00 |
20 |
12.6 |
12.6 |
15.7 |
|
|
3.00 |
76 |
47.8 |
47.8 |
63.5 |
|
|
4.00 |
58 |
36.5 |
36.5 |
100.0 |
|
|
Total |
159 |
100.0 |
100.0 |
||
|
What kind of |
|||||
|
Frequency |
Percent |
Valid Percent |
Cumulative Percent |
||
|
Valid |
1.00 |
76 |
47.8 |
47.8 |
47.8 |
|
2.00 |
46 |
28.9 |
28.9 |
76.7 |
|
|
3.00 |
28 |
17.6 |
17.6 |
94.3 |
|
|
4.00 |
9 |
5.7 |
5.7 |
100.0 |
|
|
Total |
159 |
100.0 |
100.0 |
||
|
Market1 |
|||||
|
Frequency |
Percent |
Valid Percent |
Cumulative Percent |
||
|
Valid |
1.00 |
17 |
10.7 |
10.7 |
10.7 |
|
2.00 |
6 |
3.8 |
3.8 |
14.5 |
|
|
3.00 |
31 |
19.5 |
19.5 |
34.0 |
|
|
4.00 |
52 |
32.7 |
32.7 |
66.7 |
|
|
5.00 |
53 |
33.3 |
33.3 |
100.0 |
|
|
Total |
159 |
100.0 |
100.0 |
||
|
Market2 |
|||||
|
Frequency |
Percent |
Valid Percent |
Cumulative Percent |
||
|
Valid |
1.00 |
20 |
12.6 |
12.6 |
12.6 |
|
2.00 |
19 |
11.9 |
11.9 |
24.5 |
|
|
3.00 |
46 |
28.9 |
28.9 |
53.5 |
|
|
4.00 |
45 |
28.3 |
28.3 |
81.8 |
|
|
5.00 |
29 |
18.2 |
18.2 |
100.0 |
|
|
Total |
159 |
100.0 |
100.0 |
||
|
Market3 |
|||||
|
Frequency |
Percent |
Valid Percent |
Cumulative Percent |
||
|
Valid |
1.00 |
15 |
9.4 |
9.4 |
9.4 |
|
2.00 |
23 |
14.5 |
14.5 |
23.9 |
|
|
3.00 |
42 |
26.4 |
26.4 |
50.3 |
|
|
4.00 |
42 |
26.4 |
26.4 |
76.7 |
|
|
5.00 |
37 |
23.3 |
23.3 |
100.0 |
|
|
Total |
159 |
100.0 |
100.0 |
||
|
Technology1 |
|||||
|
Frequency |
Percent |
Valid Percent |
Cumulative Percent |
||
|
Valid |
1.00 |
51 |
32.1 |
32.1 |
32.1 |
|
2.00 |
47 |
29.6 |
29.6 |
61.6 |
|
|
3.00 |
18 |
11.3 |
11.3 |
73.0 |
|
|
4.00 |
20 |
12.6 |
12.6 |
85.5 |
|
|
5.00 |
23 |
14.5 |
14.5 |
100.0 |
|
|
Total |
159 |
100.0 |
100.0 |
||
|
Technology2 |
|||||
|
Frequency |
Percent |
Valid Percent |
Cumulative Percent |
||
|
Valid |
1.00 |
49 |
30.8 |
30.8 |
30.8 |
|
2.00 |
47 |
29.6 |
29.6 |
60.4 |
|
|
3.00 |
26 |
16.4 |
16.4 |
76.7 |
|
|
4.00 |
23 |
14.5 |
14.5 |
91.2 |
|
|
5.00 |
14 |
8.8 |
8.8 |
100.0 |
|
|
Total |
159 |
100.0 |
100.0 |
||
|
Technology3 |
|||||
|
Frequency |
Percent |
Valid Percent |
Cumulative Percent |
||
|
Valid |
1.00 |
58 |
36.5 |
36.5 |
36.5 |
|
2.00 |
38 |
23.9 |
23.9 |
60.4 |
|
|
3.00 |
26 |
16.4 |
16.4 |
76.7 |
|
|
4.00 |
19 |
11.9 |
11.9 |
88.7 |
|
|
5.00 |
18 |
11.3 |
11.3 |
100.0 |
|
|
Total |
159 |
100.0 |
100.0 |
||
|
OI1 |
|||||
|
Frequency |
Percent |
Valid Percent |
Cumulative Percent |
||
|
Valid |
1.000 |
39 |
24.5 |
24.5 |
24.5 |
|
2.000 |
26 |
16.4 |
16.4 |
40.9 |
|
|
3.000 |
39 |
24.5 |
24.5 |
65.4 |
|
|
4.000 |
36 |
22.6 |
22.6 |
88.1 |
|
|
5.000 |
19 |
11.9 |
11.9 |
100.0 |
|
|
Total |
159 |
100.0 |
100.0 |
||
|
OI2 |
|||||
|
Frequency |
Percent |
Valid Percent |
Cumulative Percent |
||
|
Valid |
1.00 |
23 |
14.5 |
14.5 |
14.5 |
|
2.00 |
14 |
8.8 |
8.8 |
23.3 |
|
|
3.00 |
42 |
26.4 |
26.4 |
49.7 |
|
|
4.00 |
49 |
30.8 |
30.8 |
80.5 |
|
|
5.00 |
31 |
19.5 |
19.5 |
100.0 |
|
|
Total |
159 |
100.0 |
100.0 |
||
|
OI3 |
|||||
|
Frequency |
Percent |
Valid Percent |
Cumulative Percent |
||
|
Valid |
1.00 |
28 |
17.6 |
17.6 |
17.6 |
|
2.00 |
26 |
16.4 |
16.4 |
34.0 |
|
|
3.00 |
39 |
24.5 |
24.5 |
58.5 |
|
|
4.00 |
42 |
26.4 |
26.4 |
84.9 |
|
|
5.00 |
24 |
15.1 |
15.1 |
100.0 |
|
|
Total |
159 |
100.0 |
100.0 |
||
|
OP1 |
|||||
|
Frequency |
Percent |
Valid Percent |
Cumulative Percent |
||
|
Valid |
1.00 |
25 |
15.7 |
15.7 |
15.7 |
|
2.00 |
14 |
8.8 |
8.8 |
24.5 |
|
|
3.00 |
25 |
15.7 |
15.7 |
40.3 |
|
|
4.00 |
55 |
34.6 |
34.6 |
74.8 |
|
|
5.00 |
40 |
25.2 |
25.2 |
100.0 |
|
|
Total |
159 |
100.0 |
100.0 |
||
|
OP2 |
|||||
|
Frequency |
Percent |
Valid Percent |
Cumulative Percent |
||
|
Valid |
1.00 |
32 |
20.1 |
20.1 |
20.1 |
|
2.00 |
20 |
12.6 |
12.6 |
32.7 |
|
|
3.00 |
52 |
32.7 |
32.7 |
65.4 |
|
|
4.00 |
30 |
18.9 |
18.9 |
84.3 |
|
|
5.00 |
25 |
15.7 |
15.7 |
100.0 |
|
|
Total |
159 |
100.0 |
100.0 |
||
|
OP3 |
|||||
|
Frequency |
Percent |
Valid Percent |
Cumulative Percent |
||
|
Valid |
1.00 |
26 |
16.4 |
16.4 |
16.4 |
|
2.00 |
17 |
10.7 |
10.7 |
27.0 |
|
|
3.00 |
46 |
28.9 |
28.9 |
56.0 |
|
|
4.00 |
43 |
27.0 |
27.0 |
83.0 |
|
|
5.00 |
27 |
17.0 |
17.0 |
100.0 |
|
|
Total |
159 |
100.0 |
100.0 |
||
Family Ownership
|
Model Summary |
||||
|
Model |
R |
R Square |
Adjusted R Square |
Std. Error of the Estimate |
|
1 |
.650a |
.422 |
.385 |
.78713 |
|
ANOVAa |
||||||
|
Model |
Sum of Squares |
df |
Mean Square |
F |
Sig. |
|
|
1 |
Regression |
21.259 |
3 |
7.086 |
11.437 |
.000b |
|
Residual |
29.120 |
47 |
.620 |
|||
|
Total |
50.379 |
50 |
||||
|
Coefficientsa |
||||||
|
Model |
Unstandardized Coefficients |
Standardized Coefficients |
t |
Sig. |
||
|
B |
Std. Error |
Beta |
||||
|
1 |
(Constant) |
1.227 |
.505 |
2.430 |
.019 |
|
|
OI |
.487 |
.111 |
.530 |
4.380 |
.000 |
|
|
Technology |
.348 |
.170 |
.245 |
2.052 |
.046 |
|
|
Market |
-.019 |
.128 |
-.017 |
-.144 |
.886 |
|
|
a. Dependent Variable: ALLOP |
||||||
Shareholding system
|
Correlations |
|||||
|
ALLOP |
ALLOI |
ALLTechnology |
ALLMarket |
||
|
ALLOP |
Pearson Correlation |
1 |
.779** |
.553** |
.497** |
|
Sig. (2-tailed) |
.000 |
.000 |
.000 |
||
|
N |
56 |
56 |
56 |
56 |
|
|
ALLOI |
Pearson Correlation |
.779** |
1 |
.530** |
.533** |
|
Sig. (2-tailed) |
.000 |
.000 |
.000 |
||
|
N |
56 |
56 |
56 |
56 |
|
|
ALLTechnology |
Pearson Correlation |
.553** |
.530** |
1 |
.504** |
|
Sig. (2-tailed) |
.000 |
.000 |
.000 |
||
|
N |
56 |
56 |
56 |
56 |
|
|
ALLMarket |
Pearson Correlation |
.497** |
.533** |
.504** |
1 |
|
Sig. (2-tailed) |
.000 |
.000 |
.000 |
||
|
N |
56 |
56 |
56 |
56 |
|
|
**. Correlation is significant at the 0.01 level (2-tailed). |
|||||
|
Model Summary |
||||
|
Model |
R |
R Square |
Adjusted R Square |
Std. Error of the Estimate |
|
1 |
.798a |
.636 |
.615 |
.73565 |
|
a. Predictors: (Constant), ALLMarket, ALLTechnology, ALLOI |
||||
|
ANOVAa |
||||||
|
Model |
Sum of Squares |
df |
Mean Square |
F |
Sig. |
|
|
1 |
Regression |
49.174 |
3 |
16.391 |
30.288 |
.000b |
|
Residual |
28.142 |
52 |
.541 |
|||
|
Total |
77.315 |
55 |
||||
|
a. Dependent Variable: ALLOP |
||||||
|
b. Predictors: (Constant), ALLMarket, ALLTechnology, ALLOI |
||||||
|
Coefficientsa |
||||||
|
Model |
Unstandardized Coefficients |
Standardized Coefficients |
t |
Sig. |
||
|
B |
Std. Error |
Beta |
||||
|
1 |
(Constant) |
.338 |
.393 |
.861 |
.393 |
|
|
ALLOI |
.653 |
.106 |
.653 |
6.170 |
.000 |
|
|
Technology |
.202 |
.119 |
.176 |
1.700 |
.095 |
|
|
Market |
.075 |
.130 |
.060 |
.579 |
.565 |
|
|
a. Dependent Variable: ALLOP |
||||||
Sole
|
Correlations |
|||||
|
ALLOP |
ALLOI |
ALLTechnology |
ALLMarket |
||
|
ALLOP |
Pearson Correlation |
1 |
.652** |
.612** |
.569** |
|
Sig. (2-tailed) |
.000 |
.000 |
.000 |
||
|
N |
52 |
52 |
52 |
52 |
|
|
ALLOI |
Pearson Correlation |
.652** |
1 |
.455** |
.494** |
|
Sig. (2-tailed) |
.000 |
.001 |
.000 |
||
|
N |
52 |
52 |
52 |
52 |
|
|
Technology |
Pearson Correlation |
.612** |
.455** |
1 |
.567** |
|
Sig. (2-tailed) |
.000 |
.001 |
.000 |
||
|
N |
52 |
52 |
52 |
52 |
|
|
Market |
Pearson Correlation |
.569** |
.494** |
.567** |
1 |
|
Sig. (2-tailed) |
.000 |
.000 |
.000 |
||
|
N |
52 |
52 |
52 |
52 |
|
|
**. Correlation is significant at the 0.01 level (2-tailed). |
|||||
|
Model Summary |
||||
|
Model |
R |
R Square |
Adjusted R Square |
Std. Error of the Estimate |
|
1 |
.756a |
.571 |
.544 |
.81451 |
|
a. Predictors: (Constant), ALLMarket, ALLOI, ALLTechnology |
||||
|
ANOVAa |
||||||
|
Model |
Sum of Squares |
df |
Mean Square |
F |
Sig. |
|
|
1 |
Regression |
42.386 |
3 |
14.129 |
21.297 |
.000b |
|
Residual |
31.844 |
48 |
.663 |
|||
|
Total |
74.231 |
51 |
||||
|
Coefficientsa |
||||||
|
Model |
Unstandardized Coefficients |
Standardized Coefficients |
t |
Sig. |
||
|
B |
Std. Error |
Beta |
||||
|
1 |
(Constant) |
.267 |
.404 |
.662 |
.511 |
|
|
OI |
.414 |
.111 |
.417 |
3.722 |
.001 |
|
|
Technology |
.313 |
.116 |
.320 |
2.704 |
.009 |
|
|
Market |
.208 |
.139 |
.181 |
1.493 |
.142 |
|